Esta página no es una página oficial de la aplicación ni de su desarrollador, sino una publicación editorial independiente creada con fines informativos y de comentario. Salvo que se indique expresamente lo contrario, ni la aplicación ni su desarrollador están afiliados, respaldados, patrocinados, autorizados ni conectados oficialmente con MWM, Apple, Google Play, el editor de la aplicación ni su desarrollador, y nada en esta página implica que la aplicación haya sido desarrollada utilizando los servicios de MWM. Todas las marcas comerciales, logotipos, capturas de pantalla y demás contenidos son propiedad de sus respectivos propietarios.

Merriman Market Analyst
Domina el arte de identificar máximos y mínimos. Aprovecha las puntuaciones históricas de Valor Ponderado Solar/Lunar para identificar zonas de reversión de alta probabilidad y sincroniza tus operaciones con precisión institucional.
Descargas
100Valoración
Total valoraciones
0Editor
Categoría
FinanceIdiomas
1Última versión
1.0.9Tamaño
14.1 MBFecha de lanzamiento
23 may 2024Domina la Sincronización del Mercado con Precisión Cíclica
Aprovecha los datos históricos solares/lunares y las puntuaciones propietarias de Valor Ponderado para identificar zonas de reversión de alta probabilidad antes de que ocurran.
Puntuaciones WV Propietarias
Evalúa instantáneamente la probabilidad de reversión utilizando valores ponderados basados en décadas de estudios históricos de correlación Sol/Luna.
Alertas de Reversión de Precisión
Mantente a la vanguardia de la tendencia con notificaciones cuando las puntuaciones WV superen 138, lo que indica la mayor probabilidad de un movimiento del mercado del 3%.
Las siguientes capturas de pantalla y la descripción provienen directamente del listado oficial de la tienda de la aplicación y son propiedad del desarrollador.
App Store
Capturas
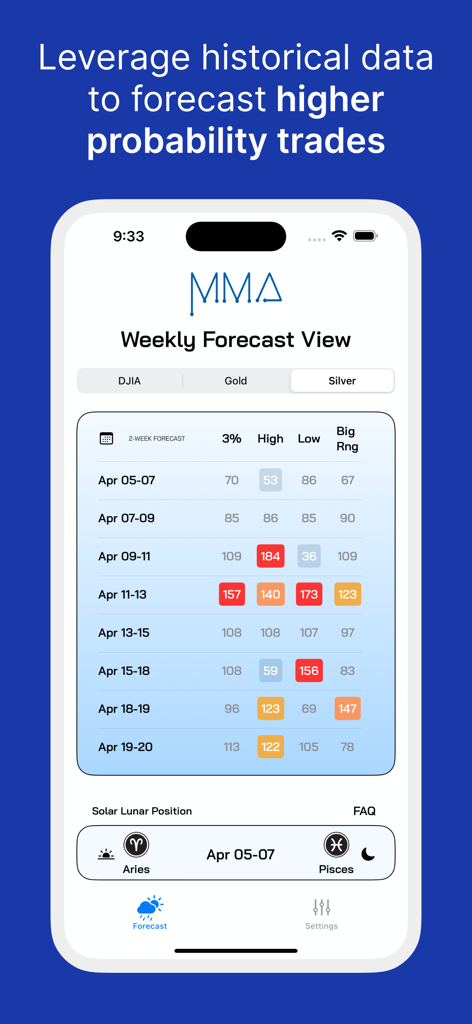
Vista de Pronóstico Semanal en la aplicación MMA que muestra puntuaciones de sincronización del mercado para Plata basadas en posiciones solares y lunares.
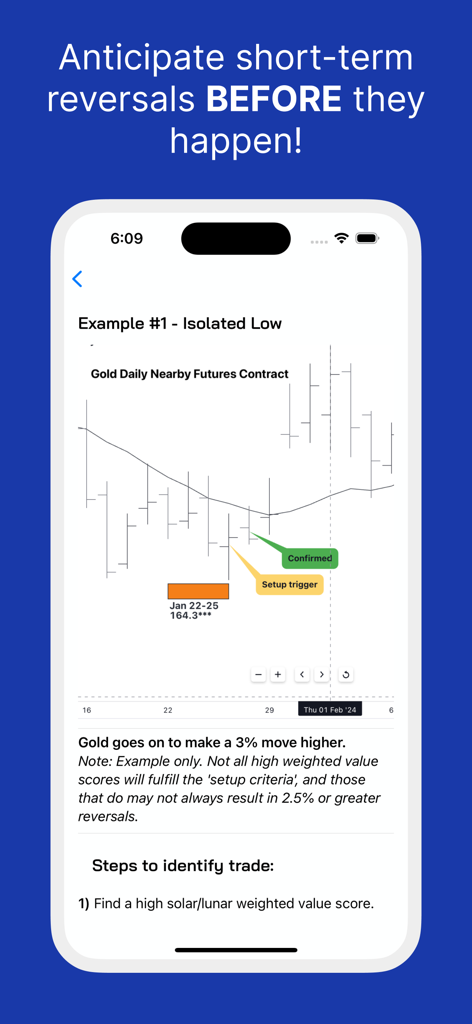
Un gráfico de futuros de oro que muestra una señal de reversión de mínimo aislada en la aplicación Merriman Market Analyst.
Pantalla de presentación de la aplicación Merriman Market Analyst con pronósticos solares lunares y señales de reversión del mercado.
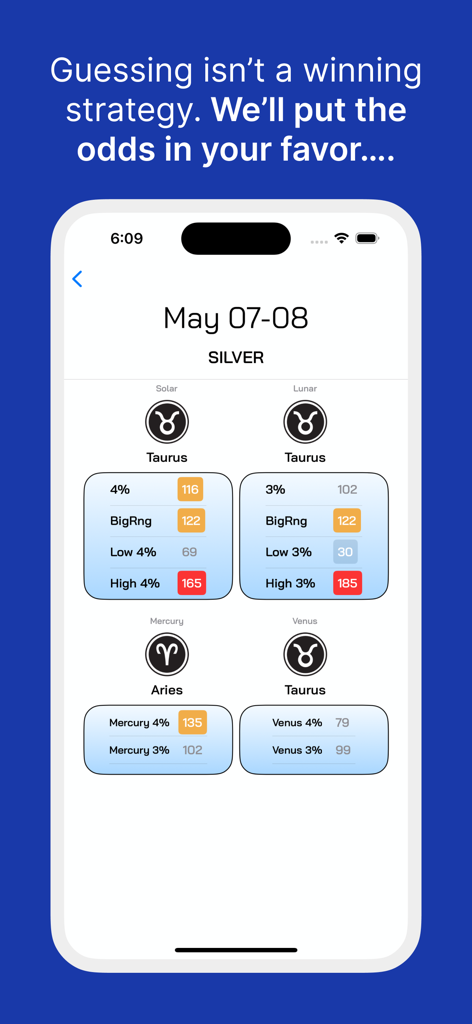
Interfaz de la aplicación Merriman Market Analyst que muestra puntuaciones de valor ponderado para operaciones de plata basadas en ciclos solares y lunares.
Descripción
Download
Apps Similares
Apps mejor clasificadas en la misma categoría

电子税务局
State Administration of Taxation

UnionPay APP
China Unionpay Co.,Ltd.

养基宝 - 年轻人的养基神器
Shenzhen Xiaoduotou Information Technology Co.,Ltd.

PayPal - Pay, Send, Save
PayPal, Inc.

中国农业银行
AGRICULTURAL BANK OF CHINA LIMITED

Mercado Pago: cuenta digital
MercadoLibre S.A.

Kalshi: Trade on the Big Game
KALSHI INC.

中国工商银行
Industrial and Commercial Bank of China

个人所得税
State Administration of Taxation
Esta página no es una página oficial de la aplicación ni de su desarrollador, sino una publicación editorial independiente creada con fines informativos y de comentario. Salvo que se indique expresamente lo contrario, ni la aplicación ni su desarrollador están afiliados, respaldados, patrocinados, autorizados ni conectados oficialmente con MWM, Apple, Google Play, el editor de la aplicación ni su desarrollador, y nada en esta página implica que la aplicación haya sido desarrollada utilizando los servicios de MWM. Todas las marcas comerciales, logotipos, capturas de pantalla y demás contenidos son propiedad de sus respectivos propietarios.