Esta página no es una página oficial de la aplicación ni de su desarrollador, sino una publicación editorial independiente creada con fines informativos y de comentario. Salvo que se indique expresamente lo contrario, ni la aplicación ni su desarrollador están afiliados, respaldados, patrocinados, autorizados ni conectados oficialmente con MWM, Apple, Google Play, el editor de la aplicación ni su desarrollador, y nada en esta página implica que la aplicación haya sido desarrollada utilizando los servicios de MWM. Todas las marcas comerciales, logotipos, capturas de pantalla y demás contenidos son propiedad de sus respectivos propietarios.

Stock Screener Pro - Technical
Deje de revisar gráficos uno por uno. Combine múltiples indicadores como MACD, RSI y patrones de velas para filtrar todo el mercado de EE. UU. en segundos: investigación basada en datos diseñada para su ritual nocturno.
Descargas
100K+Valoración
Total valoraciones
0Editor
Categoría
FinanceIdiomas
1Última versión
1.6Tamaño
8.6 MBFecha de lanzamiento
2 dic 2015Domine el Mercado con el Escaneo Técnico de Precisión
Ahorre horas de investigación manual filtrando miles de acciones de EE. UU. mediante indicadores técnicos avanzados adaptados para el swing trader disciplinado.
Escaneo Potente Multi-Indicador
Combine múltiples señales técnicas como MACD, RSI y volumen de precios en un solo escaneo para encontrar configuraciones de trading de alta probabilidad en segundos.
Creado para su Ritual Nocturno
Perfecto para profesionales ocupados. Utilice datos fiables de fin de día para planificar sus operaciones después del trabajo sin la presión del ruido del mercado en tiempo real.
Las siguientes capturas de pantalla y la descripción provienen directamente del listado oficial de la tienda de la aplicación y son propiedad del desarrollador.
App Store
Capturas
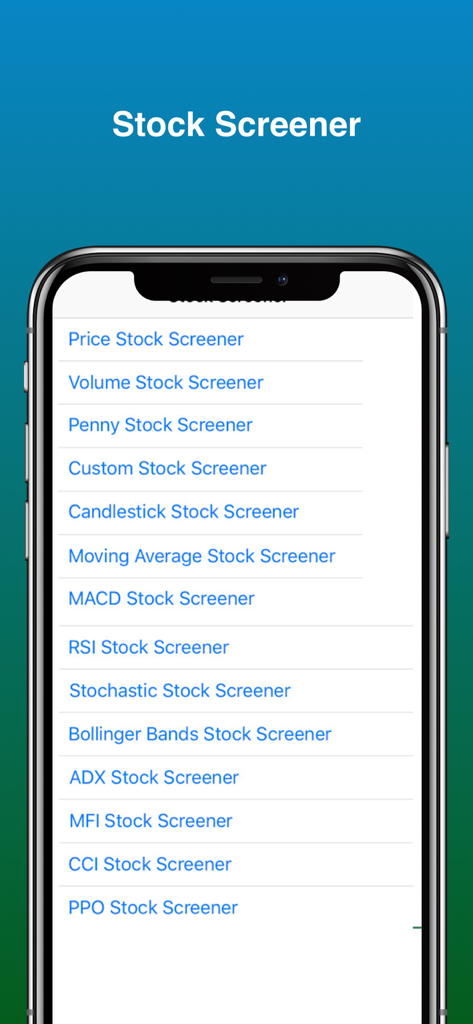
Menú principal de Stock Screener Pro que muestra indicadores de análisis técnico como MACD, RSI y bandas de Bollinger
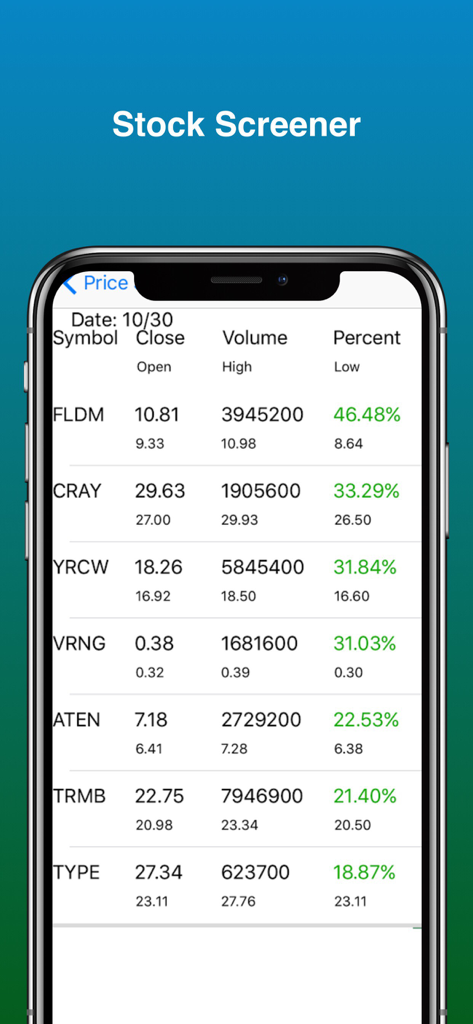
Lista de las acciones con mayores ganancias con datos de precio y volumen en la aplicación Stock Screener Pro
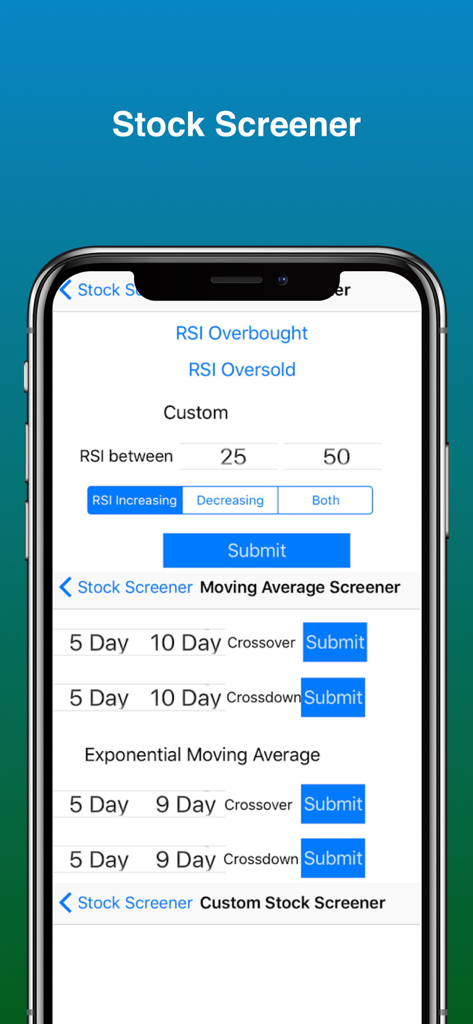
Interfaz de la aplicación Stock Screener Pro que muestra herramientas de análisis técnico y ajustes del filtro RSI
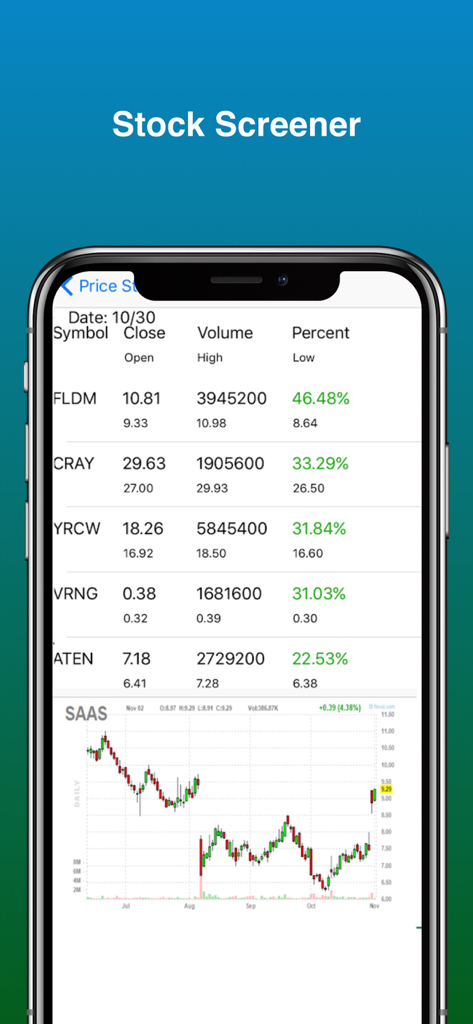
Aplicación Stock Screener Pro que muestra una lista de acciones y un gráfico técnico de velas japonesas
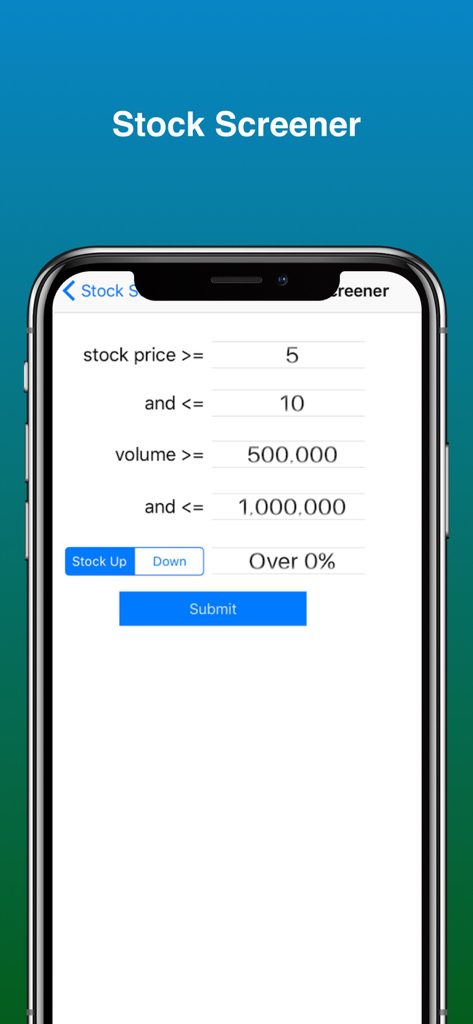
Interfaz para configurar filtros de precio de acciones y volumen en Stock Screener Pro
Descripción
Download
Apps Similares
Apps mejor clasificadas en la misma categoría

电子税务局
State Administration of Taxation

UnionPay APP
China Unionpay Co.,Ltd.

养基宝 - 年轻人的养基神器
Shenzhen Xiaoduotou Information Technology Co.,Ltd.

PayPal - Pay, Send, Save
PayPal, Inc.

中国农业银行
AGRICULTURAL BANK OF CHINA LIMITED

Mercado Pago: cuenta digital
MercadoLibre S.A.

Kalshi: Trade on the Big Game
KALSHI INC.

中国工商银行
Industrial and Commercial Bank of China

个人所得税
State Administration of Taxation
Esta página no es una página oficial de la aplicación ni de su desarrollador, sino una publicación editorial independiente creada con fines informativos y de comentario. Salvo que se indique expresamente lo contrario, ni la aplicación ni su desarrollador están afiliados, respaldados, patrocinados, autorizados ni conectados oficialmente con MWM, Apple, Google Play, el editor de la aplicación ni su desarrollador, y nada en esta página implica que la aplicación haya sido desarrollada utilizando los servicios de MWM. Todas las marcas comerciales, logotipos, capturas de pantalla y demás contenidos son propiedad de sus respectivos propietarios.