Cette page n'est pas une page officielle de l'application ou de son développeur, mais une publication éditoriale indépendante créée à des fins d'information et de commentaire. Sauf indication expresse contraire, ni l'application ni son développeur ne sont affiliés, approuvés, sponsorisés, autorisés ou autrement officiellement liés à MWM, Apple, Google Play, à l'éditeur de l'application ou au développeur de l'application, et rien sur cette page n'implique que l'application a été développée en utilisant les services de MWM. Toutes les marques, logos, captures d'écran et autres contenus restent la propriété de leurs propriétaires respectifs.

Merriman Market Analyst
Maîtrisez l'art de choisir les sommets et les creux. Tirez parti des scores historiques de valeur pondérée solaire/lunaire pour identifier les zones d'inversion à forte probabilité et synchroniser vos transactions avec une précision institutionnelle.
Téléchargements
100Note
Nombre d'avis
0Éditeur
Catégorie
FinanceLangues
1Dernière version
1.0.9Taille
14.1 MBDate de sortie
23 mai 2024Maîtrisez le timing de marché avec une précision cyclique
Tirez parti des données solaires/lunaires historiques et des scores propriétaires de valeur pondérée pour identifier les zones d'inversion à forte probabilité avant qu'elles ne se produisent.
Scores WV propriétaires
Évaluez instantanément la probabilité d'inversion à l'aide de valeurs pondérées basées sur des décennies d'études historiques de corrélation Soleil/Lune.
Alertes d'inversion de précision
Gardez une longueur d'avance sur la tendance avec des notifications lorsque les scores WV dépassent 138, signalant la plus forte probabilité d'un mouvement de marché de 3 %.
Les captures d'écran et la description suivantes proviennent directement de la fiche officielle de l'application sur le store et sont la propriété du développeur.
App Store
Captures
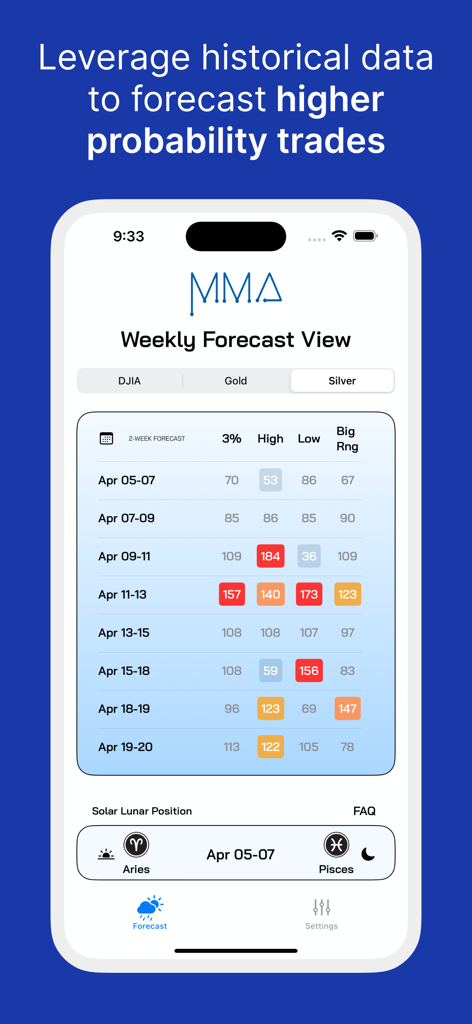
Vue de la prévision hebdomadaire dans l'application MMA montrant les scores de timing du marché pour l'argent en fonction des positions solaires et lunaires.
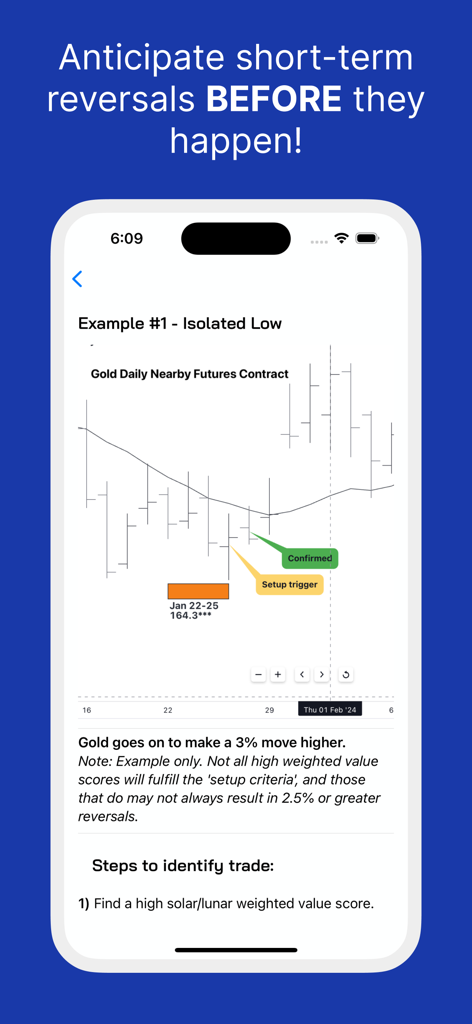
Un graphique des futures sur l'or montrant un signal d'inversion bas isolé dans l'application Merriman Market Analyst
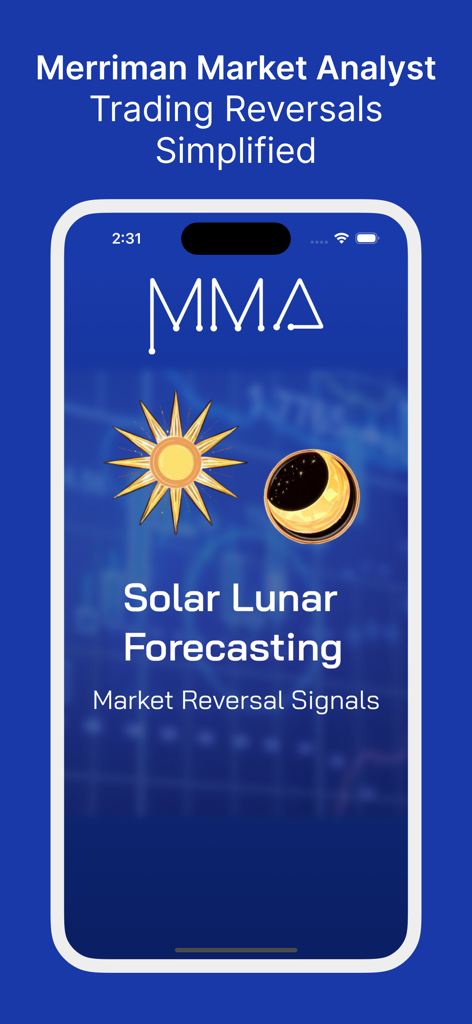
Écran d'accueil de l'application Merriman Market Analyst présentant des prévisions soleil-lune et des signaux d'inversion de marché
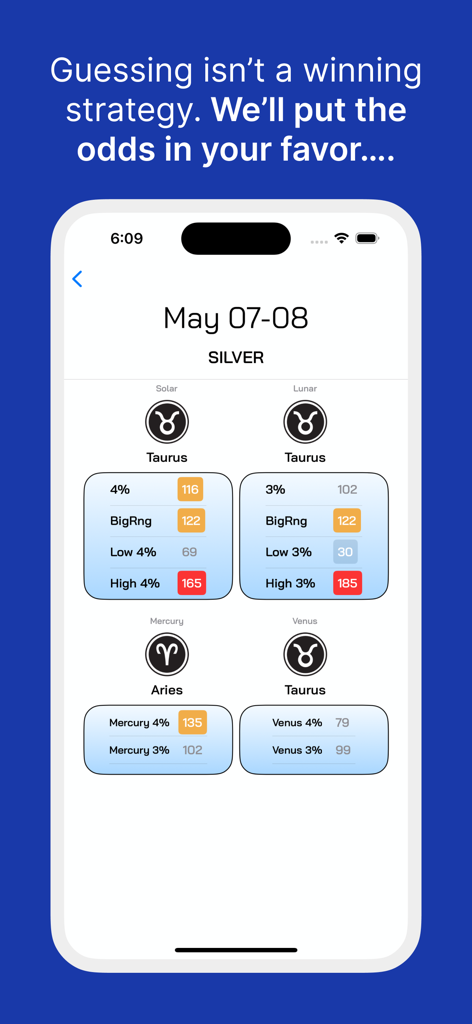
Interface de l'application Merriman Market Analyst affichant les scores de valeur pondérée pour le trading de l'argent en fonction des cycles solaires et lunaires
Description
Download
Apps Similaires
Apps les mieux classées dans la même catégorie

电子税务局
State Administration of Taxation

UnionPay APP
China Unionpay Co.,Ltd.

养基宝 - 年轻人的养基神器
Shenzhen Xiaoduotou Information Technology Co.,Ltd.

PayPal - Pay, Send, Save
PayPal, Inc.

中国农业银行
AGRICULTURAL BANK OF CHINA LIMITED

Mercado Pago: cuenta digital
MercadoLibre S.A.

Kalshi: Trade on the Big Game
KALSHI INC.

中国工商银行
Industrial and Commercial Bank of China

个人所得税
State Administration of Taxation
Cette page n'est pas une page officielle de l'application ou de son développeur, mais une publication éditoriale indépendante créée à des fins d'information et de commentaire. Sauf indication expresse contraire, ni l'application ni son développeur ne sont affiliés, approuvés, sponsorisés, autorisés ou autrement officiellement liés à MWM, Apple, Google Play, à l'éditeur de l'application ou au développeur de l'application, et rien sur cette page n'implique que l'application a été développée en utilisant les services de MWM. Toutes les marques, logos, captures d'écran et autres contenus restent la propriété de leurs propriétaires respectifs.