Cette page n'est pas une page officielle de l'application ou de son développeur, mais une publication éditoriale indépendante créée à des fins d'information et de commentaire. Sauf indication expresse contraire, ni l'application ni son développeur ne sont affiliés, approuvés, sponsorisés, autorisés ou autrement officiellement liés à MWM, Apple, Google Play, à l'éditeur de l'application ou au développeur de l'application, et rien sur cette page n'implique que l'application a été développée en utilisant les services de MWM. Toutes les marques, logos, captures d'écran et autres contenus restent la propriété de leurs propriétaires respectifs.

Stock Screener Pro - Technical
Arrêtez de vérifier les graphiques un par un. Combinez plusieurs indicateurs comme le MACD, le RSI et les modèles de chandeliers pour filtrer l'ensemble du marché américain en quelques secondes — une recherche basée sur les données conçue pour votre rituel du soir.
Téléchargements
100K+Note
Nombre d'avis
0Éditeur
Catégorie
FinanceLangues
1Dernière version
1.6Taille
8.6 MBDate de sortie
2 déc. 2015Maîtrisez le marché avec un scan technique de précision
Gagnez des heures de recherche manuelle en filtrant des milliers d'actions américaines grâce à des indicateurs techniques avancés conçus pour le swing trader discipliné.
Scan puissant multi-indicateurs
Combinez plusieurs signaux techniques comme le MACD, le RSI et le volume des prix dans un seul scan pour trouver des configurations de trading à haute probabilité en quelques secondes.
Conçu pour votre rituel du soir
Parfait pour les professionnels occupés. Utilisez des données fiables de fin de journée pour planifier vos transactions après le travail, sans la pression du bruit du marché en temps réel.
Les captures d'écran et la description suivantes proviennent directement de la fiche officielle de l'application sur le store et sont la propriété du développeur.
App Store
Captures
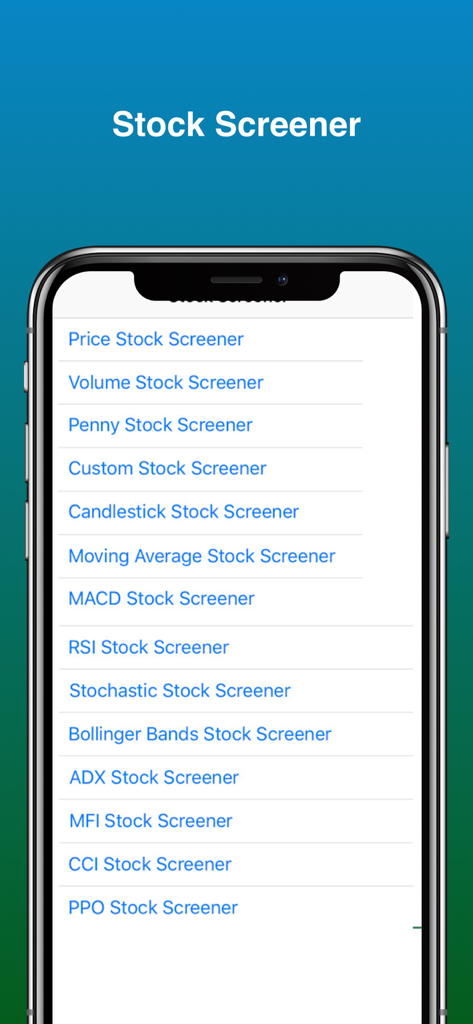
Menu principal de Stock Screener Pro montrant des indicateurs d'analyse technique comme MACD, RSI et Bandes de Bollinger
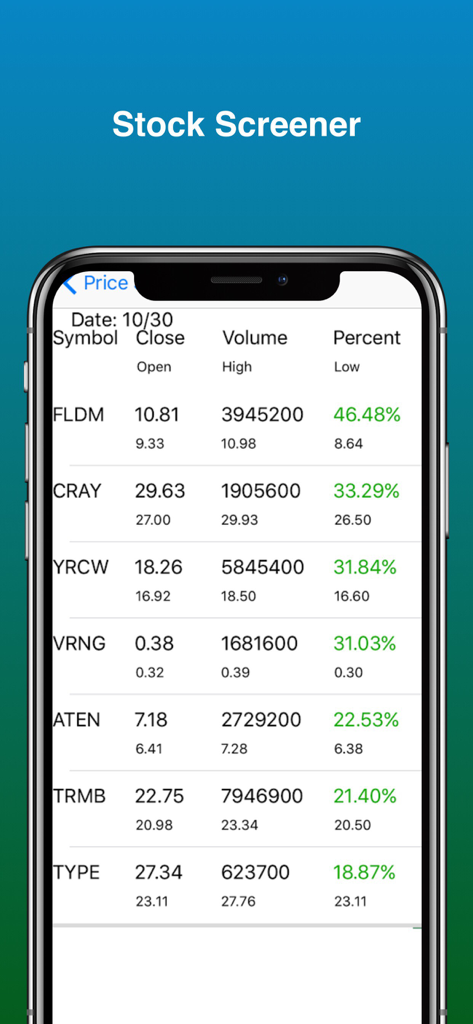
Liste des plus fortes hausses d'actions avec les données de prix et de volume sur l'application Stock Screener Pro
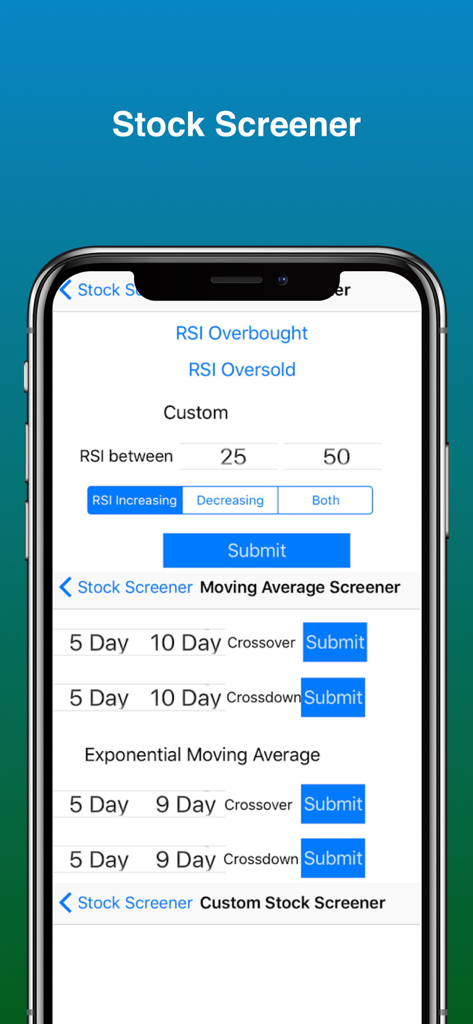
Interface de l'application Stock Screener Pro affichant des outils d'analyse technique et des paramètres de filtrage RSI
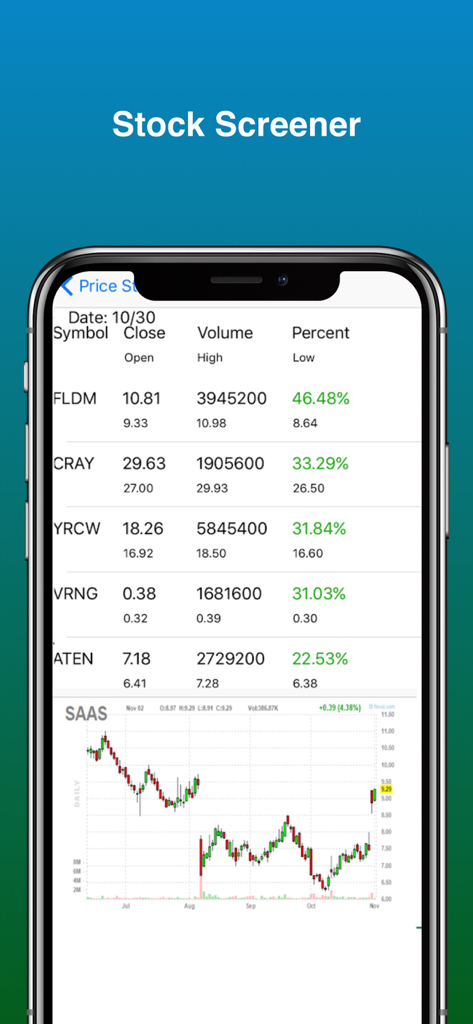
L'application Stock Screener Pro affichant une liste d'actions et un graphique technique en chandeliers
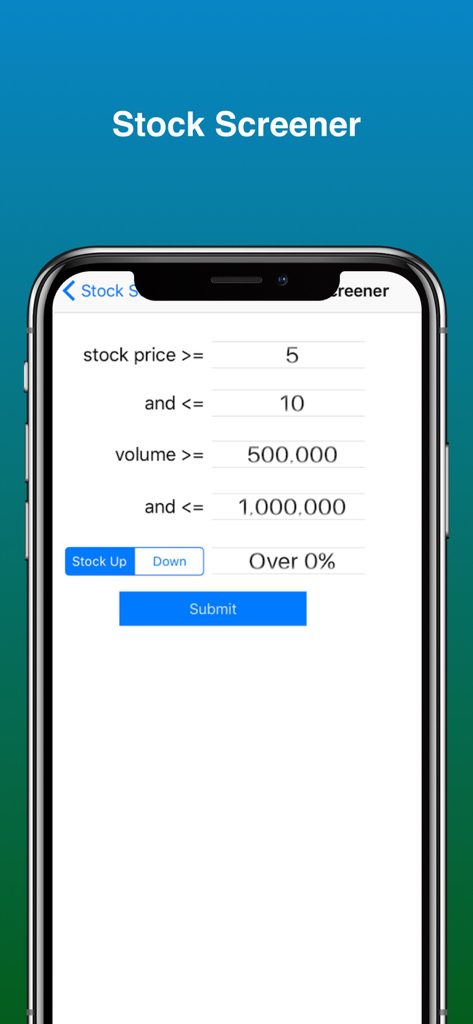
Interface pour le réglage des filtres de prix et de volume des actions dans Stock Screener Pro
Description
Download
Apps Similaires
Apps les mieux classées dans la même catégorie

电子税务局
State Administration of Taxation

UnionPay APP
China Unionpay Co.,Ltd.

养基宝 - 年轻人的养基神器
Shenzhen Xiaoduotou Information Technology Co.,Ltd.

PayPal - Pay, Send, Save
PayPal, Inc.

中国农业银行
AGRICULTURAL BANK OF CHINA LIMITED

Mercado Pago: cuenta digital
MercadoLibre S.A.

Kalshi: Trade on the Big Game
KALSHI INC.

中国工商银行
Industrial and Commercial Bank of China

个人所得税
State Administration of Taxation
Cette page n'est pas une page officielle de l'application ou de son développeur, mais une publication éditoriale indépendante créée à des fins d'information et de commentaire. Sauf indication expresse contraire, ni l'application ni son développeur ne sont affiliés, approuvés, sponsorisés, autorisés ou autrement officiellement liés à MWM, Apple, Google Play, à l'éditeur de l'application ou au développeur de l'application, et rien sur cette page n'implique que l'application a été développée en utilisant les services de MWM. Toutes les marques, logos, captures d'écran et autres contenus restent la propriété de leurs propriétaires respectifs.