Cette page n'est pas une page officielle de l'application ou de son développeur, mais une publication éditoriale indépendante créée à des fins d'information et de commentaire. Sauf indication expresse contraire, ni l'application ni son développeur ne sont affiliés, approuvés, sponsorisés, autorisés ou autrement officiellement liés à MWM, Apple, Google Play, à l'éditeur de l'application ou au développeur de l'application, et rien sur cette page n'implique que l'application a été développée en utilisant les services de MWM. Toutes les marques, logos, captures d'écran et autres contenus restent la propriété de leurs propriétaires respectifs.

Stock+: Stock Market Heat Map
Arrêtez de parcourir des listes interminables de tickers. Identifiez instantanément les leaders du marché grâce à des treemaps interactifs, des indicateurs techniques professionnels et une analyse sectorielle approfondie conçue pour l'investisseur axé sur les données.
Téléchargements
2K+Note
Nombre d'avis
100Éditeur
Catégorie
FinanceLangues
3Dernière version
3.10.0Taille
21.2 MBDate de sortie
15 janv. 2024Maîtrisez le marché en un coup d'œil
Arrêtez de parcourir des listes interminables de tickers. Utilisez des cartes thermiques interactives et des indicateurs techniques professionnels pour visualiser les tendances et prendre des décisions éclairées en quelques secondes.
Cartes thermiques interactives du marché
Saisissez instantanément le sentiment du marché. Visualisez le S&P 500, le Nasdaq et le Dow Jones grâce à des treemaps codés par couleur et mis à l'échelle par capitalisation boursière.
Informations sur la rotation sectorielle
Plongez dans des secteurs et des industries spécifiques pour identifier les leaders et les retardataires. Comprenez où l'argent circule en temps réel.
Les captures d'écran et la description suivantes proviennent directement de la fiche officielle de l'application sur le store et sont la propriété du développeur.
App Store
Captures
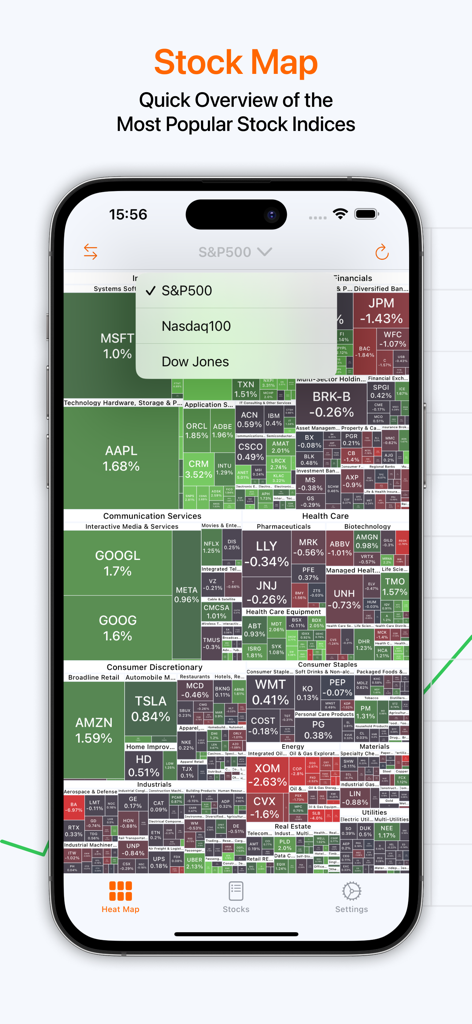
Carte thermique interactive de l'indice S&P 500 montrant la performance des actions par secteur sur une application mobile.
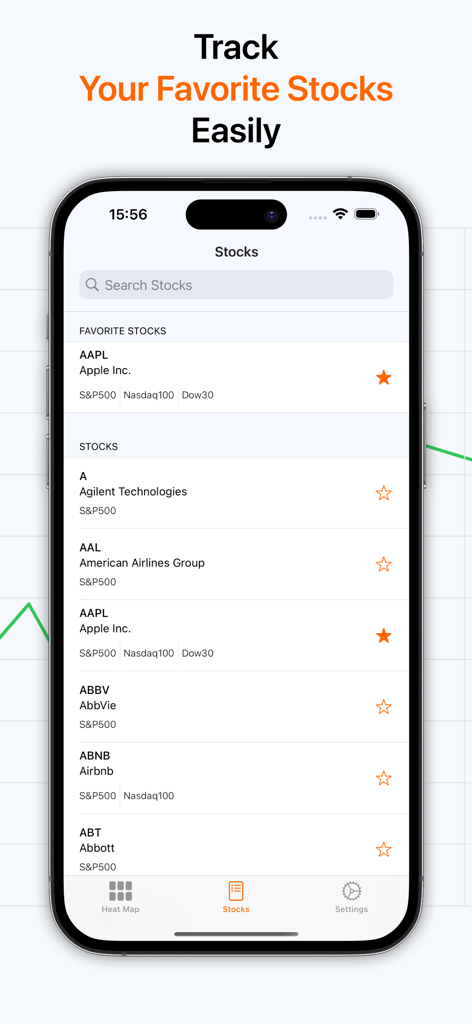
Interface d'application mobile montrant une liste d'actions favorites et une barre de recherche pour suivre la performance du marché.
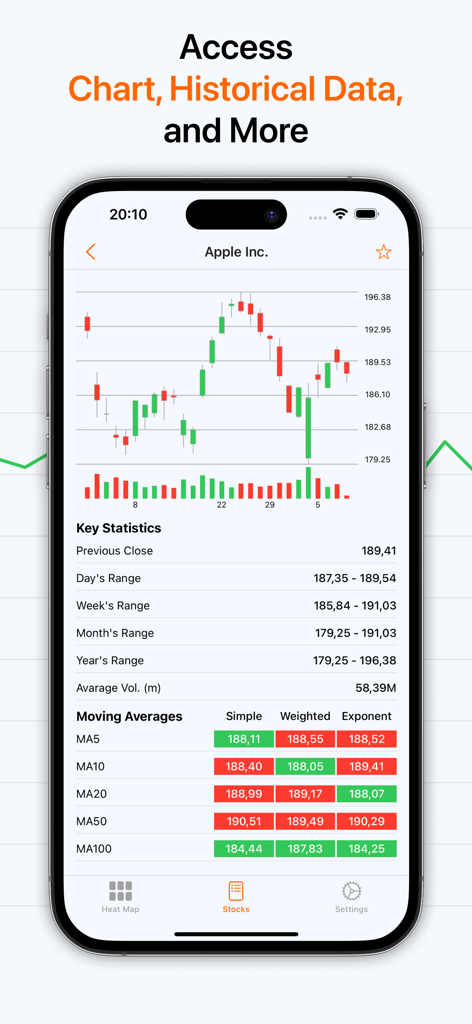
Écran d'analyse technique détaillé des actions montrant un graphique en chandeliers et un tableau des moyennes mobiles.
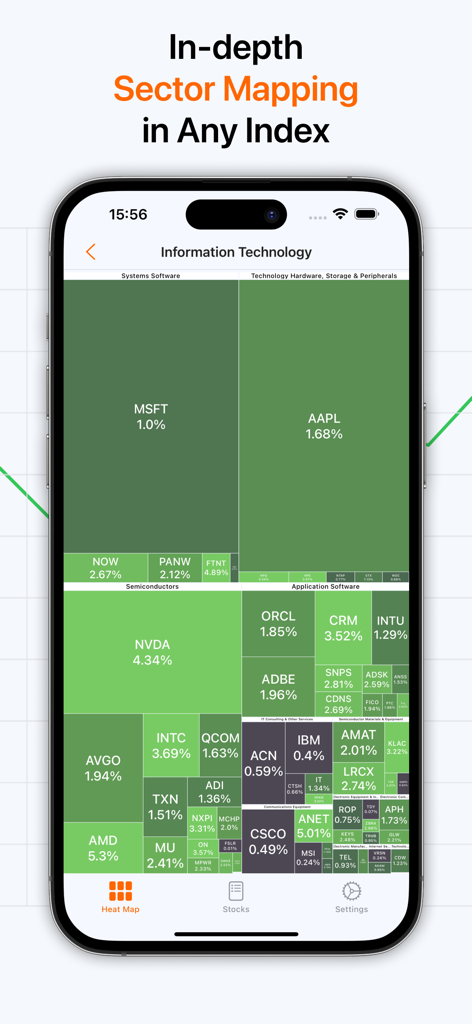
Capture d'écran d'une application mobile affichant une carte thermique interactive pour les actions de technologie de l'information.
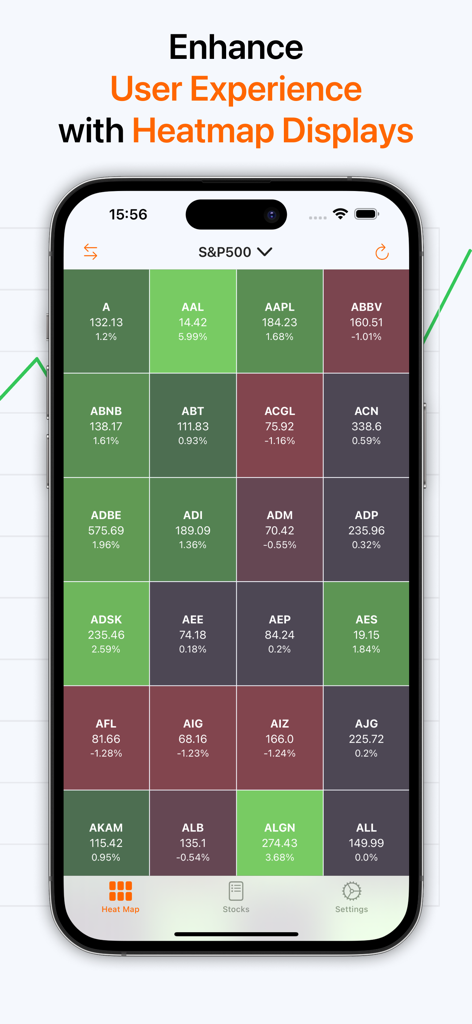
Interface d'une application mobile affichant une carte thermique codée par couleur du marché boursier pour le S&P 500.
Description
Download
Apps Similaires
Apps les mieux classées dans la même catégorie

电子税务局
State Administration of Taxation

UnionPay APP
China Unionpay Co.,Ltd.

养基宝 - 年轻人的养基神器
Shenzhen Xiaoduotou Information Technology Co.,Ltd.

PayPal - Pay, Send, Save
PayPal, Inc.

中国农业银行
AGRICULTURAL BANK OF CHINA LIMITED

Mercado Pago: cuenta digital
MercadoLibre S.A.

Kalshi: Trade on the Big Game
KALSHI INC.

中国工商银行
Industrial and Commercial Bank of China

个人所得税
State Administration of Taxation
Cette page n'est pas une page officielle de l'application ou de son développeur, mais une publication éditoriale indépendante créée à des fins d'information et de commentaire. Sauf indication expresse contraire, ni l'application ni son développeur ne sont affiliés, approuvés, sponsorisés, autorisés ou autrement officiellement liés à MWM, Apple, Google Play, à l'éditeur de l'application ou au développeur de l'application, et rien sur cette page n'implique que l'application a été développée en utilisant les services de MWM. Toutes les marques, logos, captures d'écran et autres contenus restent la propriété de leurs propriétaires respectifs.