Questa pagina non è una pagina ufficiale dell'app o del suo sviluppatore, ma una pubblicazione editoriale indipendente creata a scopo informativo e di commento. Salvo espressa indicazione contraria, né l'app né il suo sviluppatore sono affiliati, approvati, sponsorizzati, autorizzati o altrimenti ufficialmente collegati a MWM, Apple, Google Play, all'editore dell'app o allo sviluppatore dell'app, e nulla in questa pagina implica che l'app sia stata sviluppata utilizzando i servizi di MWM. Tutti i marchi, loghi, screenshot e altri contenuti rimangono di proprietà dei rispettivi proprietari.

Merriman Market Analyst
Padroneggia l'arte di identificare picchi e minimi. Sfrutta i punteggi storici Weighted Value solari/lunari per identificare zone di inversione ad alta probabilità e sincronizzare le tue operazioni con precisione istituzionale.
Download
100Valutazione
Valutazioni totali
0Editore
Categoria
FinanceLingue
1Ultima versione
1.0.9Dimensione
14.1 MBData di lancio
23 mag 2024Padroneggia il Timing di Mercato con Precisione Ciclica
Sfrutta i dati storici solari/lunari e i punteggi proprietari Weighted Value per identificare zone di inversione ad alta probabilità prima che si verifichino.
Punteggi WV Proprietari
Valuta istantaneamente la probabilità di inversione utilizzando valori ponderati basati su decenni di studi storici sulla correlazione Sole/Luna.
Avvisi di Inversione di Precisione
Rimani avanti rispetto al trend con notifiche quando i punteggi WV superano 138, segnalando la massima probabilità di una mossa di mercato del 3%.
Gli screenshot e la descrizione seguenti provengono direttamente dall'elenco ufficiale dello store dell'app e sono di proprietà dello sviluppatore.
App Store
Screenshot
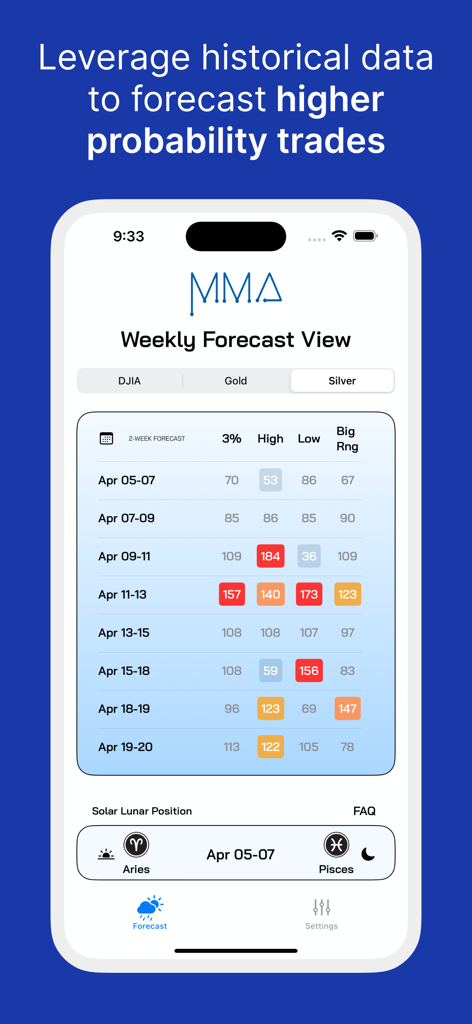
Visualizzazione del Previsione Settimanale nell'App MMA che mostra i punteggi di timing di mercato per l'Argento basati sulle posizioni solari e lunari.
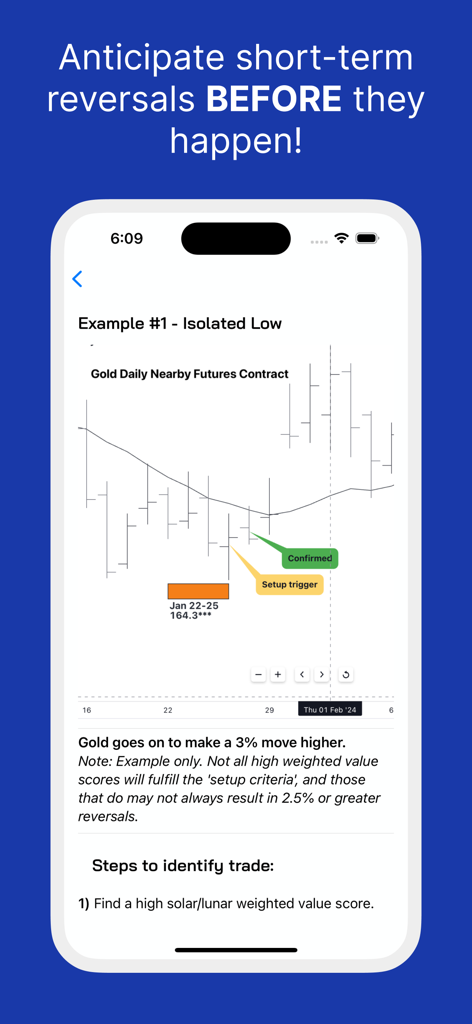
Un grafico dei futures sull'oro che mostra un segnale di inversione isolato al ribasso nell'app Merriman Market Analyst
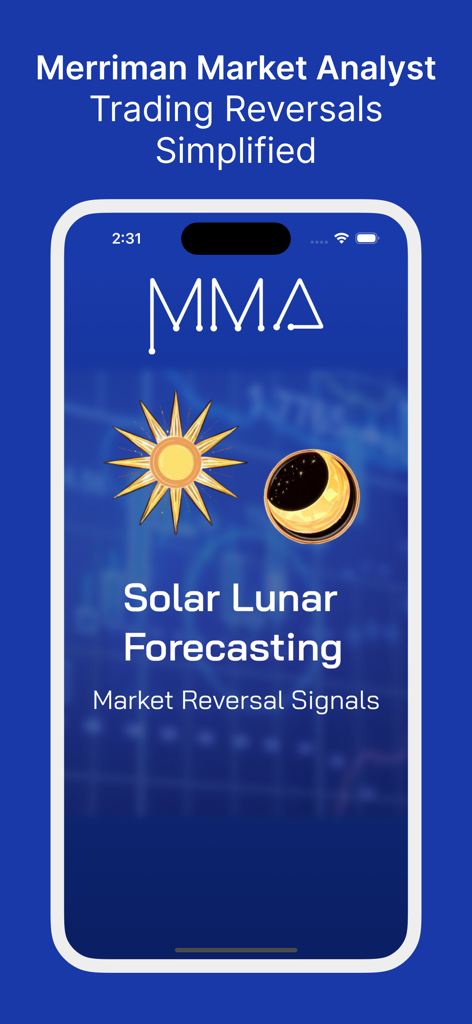
Schermata di presentazione dell'app Merriman Market Analyst con previsioni solari-lunari e segnali di inversione di mercato
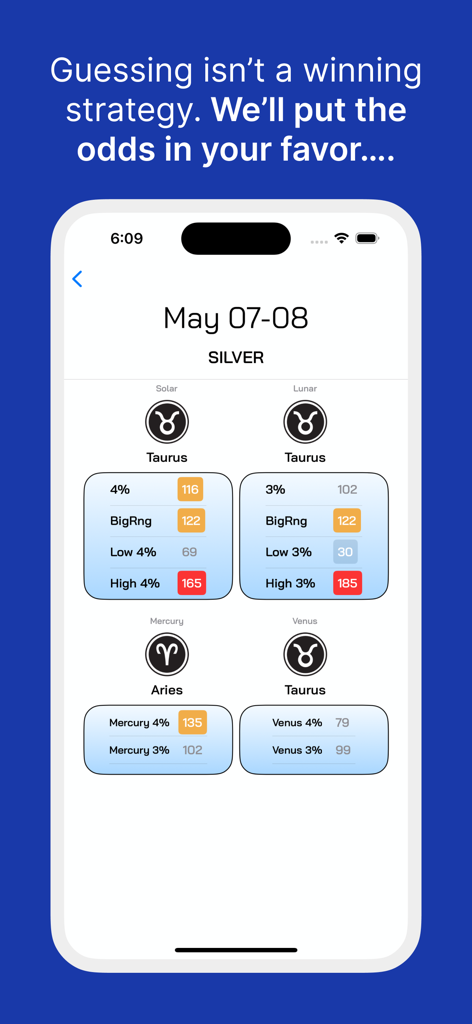
Interfaccia dell'app Merriman Market Analyst che visualizza i punteggi Weighted Value per il trading di argento basati sui cicli solari e lunari
Descrizione
Download
App Simili
App più classificate nella stessa categoria

电子税务局
State Administration of Taxation

UnionPay APP
China Unionpay Co.,Ltd.

养基宝 - 年轻人的养基神器
Shenzhen Xiaoduotou Information Technology Co.,Ltd.

PayPal - Pay, Send, Save
PayPal, Inc.

中国农业银行
AGRICULTURAL BANK OF CHINA LIMITED

Mercado Pago: cuenta digital
MercadoLibre S.A.

Kalshi: Trade on the Big Game
KALSHI INC.

中国工商银行
Industrial and Commercial Bank of China

个人所得税
State Administration of Taxation
Questa pagina non è una pagina ufficiale dell'app o del suo sviluppatore, ma una pubblicazione editoriale indipendente creata a scopo informativo e di commento. Salvo espressa indicazione contraria, né l'app né il suo sviluppatore sono affiliati, approvati, sponsorizzati, autorizzati o altrimenti ufficialmente collegati a MWM, Apple, Google Play, all'editore dell'app o allo sviluppatore dell'app, e nulla in questa pagina implica che l'app sia stata sviluppata utilizzando i servizi di MWM. Tutti i marchi, loghi, screenshot e altri contenuti rimangono di proprietà dei rispettivi proprietari.