Questa pagina non è una pagina ufficiale dell'app o del suo sviluppatore, ma una pubblicazione editoriale indipendente creata a scopo informativo e di commento. Salvo espressa indicazione contraria, né l'app né il suo sviluppatore sono affiliati, approvati, sponsorizzati, autorizzati o altrimenti ufficialmente collegati a MWM, Apple, Google Play, all'editore dell'app o allo sviluppatore dell'app, e nulla in questa pagina implica che l'app sia stata sviluppata utilizzando i servizi di MWM. Tutti i marchi, loghi, screenshot e altri contenuti rimangono di proprietà dei rispettivi proprietari.
Stock+: Stock Market Heat Map
Smetti di scorrere infiniti ticker. Identifica istantaneamente i leader di mercato con treemap interattivi, indicatori tecnici professionali e analisi settoriale approfondita, progettati per l'investitore data-driven.
Numeri Chiave
Download
2K+
Valutazione
4.4/5
Valutazioni totali
100
Editore
Kemal Bakacak
Categoria
Finance
Lingue
3
Ultima versione
3.10.0
Dimensione
21.2 MB
Data di lancio
15 gen 2024
Funzioni
Domina il Mercato a Colpo d'Occhio
Smetti di scorrere infinite liste di ticker. Usa mappe di calore interattive e indicatori tecnici professionali per visualizzare i trend e prendere decisioni informate in pochi secondi.
Mappe di Calore Interattive del Mercato
Comprendi istantaneamente il sentiment del mercato. Visualizza S&P 500, Nasdaq e Dow Jones attraverso treemap color-coded scalati per capitalizzazione di mercato.
Insight sulla Rotazione Settoriale
Approfondisci settori e industrie specifiche per identificare i leader e i follower. Comprendi dove fluiscono i soldi in tempo reale.
Gli screenshot e la descrizione seguenti provengono direttamente dall'elenco ufficiale dello store dell'app e sono di proprietà dello sviluppatore.
App Store
Screenshot
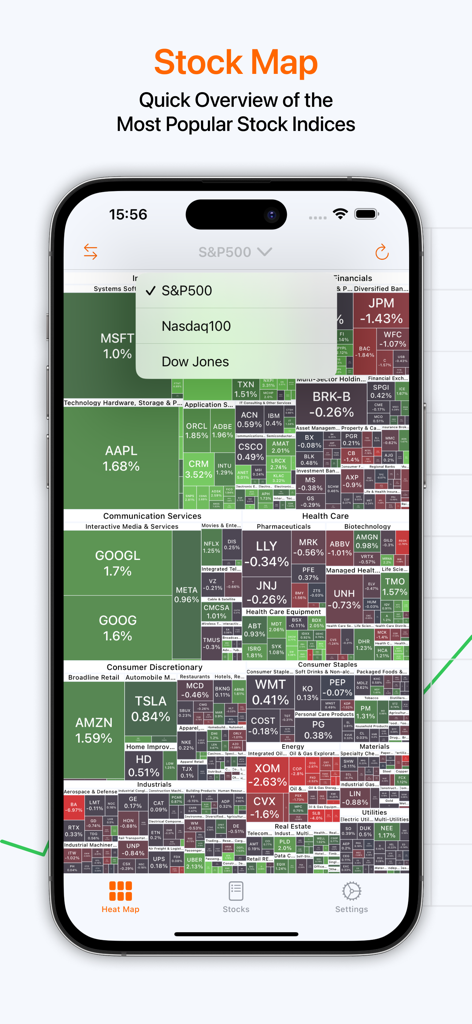
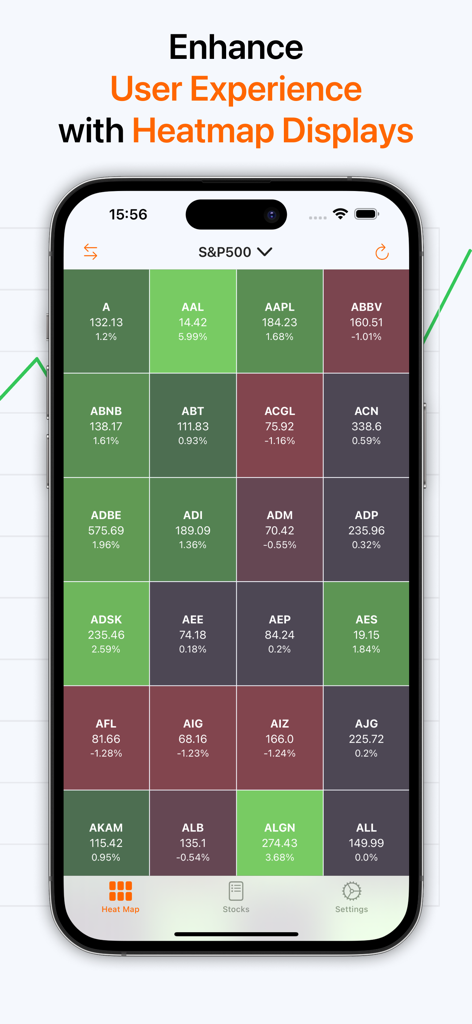
Mappa di calore interattiva dell'indice S&P 500 che mostra la performance delle azioni per settore su un'app mobile.
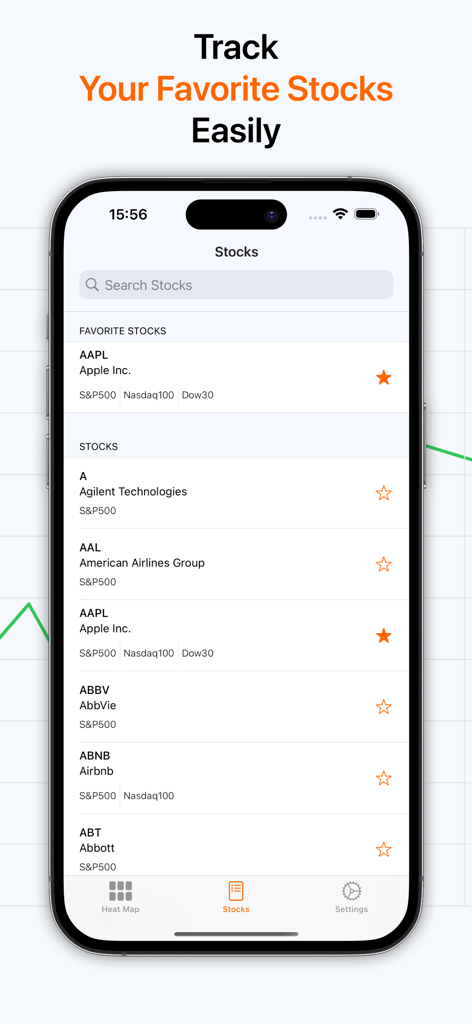
Interfaccia di un'app mobile che mostra una lista di azioni preferite e una barra di ricerca per monitorare la performance del mercato.
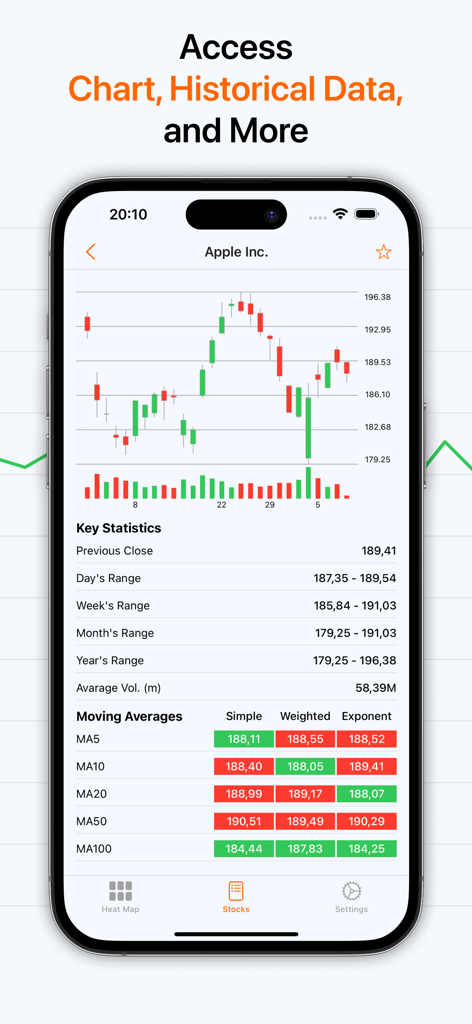
Schermata dettagliata di analisi tecnica delle azioni che mostra un grafico a candele e una tabella delle medie mobili.
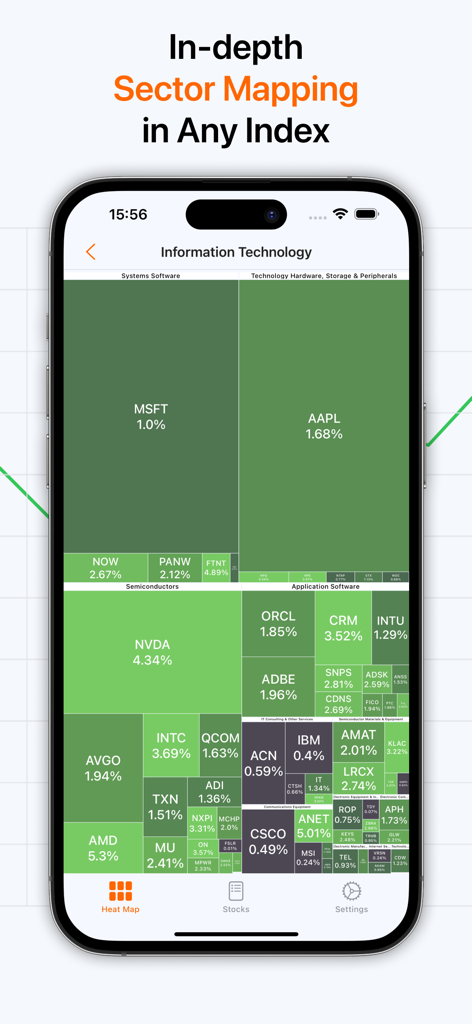
Uno screenshot di un'app mobile che visualizza una mappa di calore interattiva per le azioni di Information Technology.
Un'interfaccia di un'app mobile che mostra una mappa di calore del mercato azionario color-coded per l'S&P 500.
Descrizione
Welcome to Stock+, where your financial aspirations take flight. The most popular stock indexes are in your fingers. Explore the stocks sector by sector with interactive visualized map. Look at S&P500, Dow Jones and Nasdaq 100 stock map (heat map, treemap). Whether you're a seasoned investor or just starting on your financial journey, Stock+ is your trusted partner in building a secure and prosperous future.
Features,
- Interactive Stock Map
Easily understand with color-coded according to daily results.
- Deepdive Sector Stocks
Lots of stock in a screen. Click to any sector and new map will draw with that sector stocks. Easy to use and more understandable especially in large number of stock based indexes like S&P 500.
- Stock Detail
Choose the whatever you want stock and get more price information like well-designed candlestick graphic, daily, weekly, monthly, yearly minimum and maximum price movements.
- Favorite Stocks
Add all of your favorite stocks to list and you can easily access with them. The new list will start with your favorite stocks.
- Reliable and Secure
Your privacy and security are our utmost priority. Your favorites are kept in your phone. Holdings are transferred to our database and kept encrypted.
- User-Friendly Interface
Navigate the complexities of investing with ease. Our intuitive interface ensures that you can monitor your investments, track performance, and make informed decisions—all from the palm of your hand.
- Technical Analysis
Follow simple, weighted, exponential daily moving averages in 5, 10, 20, 50, 100, 200 day periods.
- Technical Indicators
Also follow best resulted indicators like RSI, MACD, STOCH, CCI, STOCHRSI, ATR, ADX, OU, ROC, WilliamsR and get easily signals.
- Stock Holdings
How to Work?
The stocks on a map are grouped in hierarchies. A market contains multiple sectors. A sector contains multiple industries. An industry contains multiple stocks.
For example, S&P500 index has 11 sectors (Utilities, Real Estate, Materials, Information Technology, Industrials, Health Care, Financials, Energy, Consumer Staples, Consumer Discretionary, Communication Services). All of sectors can have lots of different industries. Utilities is one of sectors and has 5 different industries (Independent Power Producers & Energy Traders, Electric Utilities, Multi-Utilities, Water Utilities, Gas Utilities). Each utilies has one or more stock.
On the other hand, different indexes has different rules. Dow Jones does not have sectors. It is only divided by industries. It contains 17 different industries (Telecommunications industry, Semiconductor industry, Retailing, Pharmaceutical industry, Petroleum industry, Managed health care, Insurance, Home Improvement, Food industry, Fast-moving consumer goods, Drink industry, Construction, Conglomerate, Clothing industry, Chemical industry, Broadcasting, Biopharmaceutical, Aerospace). Like others, each industries has one or more stock.
Stock Map visualizes the stock market with a market heat map (a.k.a. market treemap). The size of a block is determined by the market cap of that company. And the whole map is sorted by the market cap in descending order.
Subscription and Pricing:
If you choose to purchase, payment will be charged to your iTunes account, and your account will be charged for renewal within 24-hours prior to the end of the current period. Auto-renewal may be turned off at any time by going to your settings in the iTunes Store after purchase. Any unused portion of a free trial period, if offered, will be forfeited when the user purchases a subscription to that publication, where applicable
Current subscription starts from $2.99 USD/month.
Subscriptions can be deactivated at the following link: https://support.apple.com/en-us/HT202039
Privacy Policy: https://kemalbakacak.com/agreements/stock-plus-stock-map-heatmap/privacy_policy.html
Terms of Use: https://kemalbakacak.com/agreements/stock-plus-stock-map-heatmap/terms_and_conditions.html
Questa pagina non è una pagina ufficiale dell'app o del suo sviluppatore, ma una pubblicazione editoriale indipendente creata a scopo informativo e di commento. Salvo espressa indicazione contraria, né l'app né il suo sviluppatore sono affiliati, approvati, sponsorizzati, autorizzati o altrimenti ufficialmente collegati a MWM, Apple, Google Play, all'editore dell'app o allo sviluppatore dell'app, e nulla in questa pagina implica che l'app sia stata sviluppata utilizzando i servizi di MWM. Tutti i marchi, loghi, screenshot e altri contenuti rimangono di proprietà dei rispettivi proprietari.