Esta página não é uma página oficial do aplicativo ou de seu desenvolvedor, mas uma publicação editorial independente criada para fins informativos e de comentário. Salvo indicação expressa em contrário, nem o aplicativo nem seu desenvolvedor são afiliados, endossados, patrocinados, autorizados ou oficialmente conectados à MWM, Apple, Google Play, ao editor do aplicativo ou ao desenvolvedor do aplicativo, e nada nesta página implica que o aplicativo foi desenvolvido utilizando os serviços da MWM. Todas as marcas comerciais, logotipos, capturas de tela e outros conteúdos permanecem propriedade de seus respectivos proprietários.

Merriman Market Analyst
Domine a arte de identificar topos e fundos. Utilize pontuações históricas de Valor Ponderado Solar/Lunar para identificar zonas de reversão de alta probabilidade e sincronizar suas negociações com precisão institucional.
Downloads
100Avaliação
Total de avaliações
0Editor
Categoria
FinanceIdiomas
1Última versão
1.0.9Tamanho
14.1 MBData de lançamento
23 de mai. de 2024Domine o Timing de Mercado com Precisão Cíclica
Utilize dados históricos Solares/Lunares e pontuações proprietárias de Valor Ponderado para identificar zonas de reversão de alta probabilidade antes que aconteçam.
Pontuações WV Proprietárias
Avalie instantaneamente a probabilidade de reversão usando valores ponderados com base em décadas de estudos históricos de correlação Sol/Lua.
Alertas de Reversão de Precisão
Mantenha-se à frente da tendência com notificações quando as pontuações WV excederem 138, sinalizando a maior probabilidade de um movimento de mercado de 3%.
As capturas de tela e a descrição a seguir são provenientes diretamente da listagem oficial da loja do aplicativo e são propriedade do desenvolvedor.
App Store
Capturas
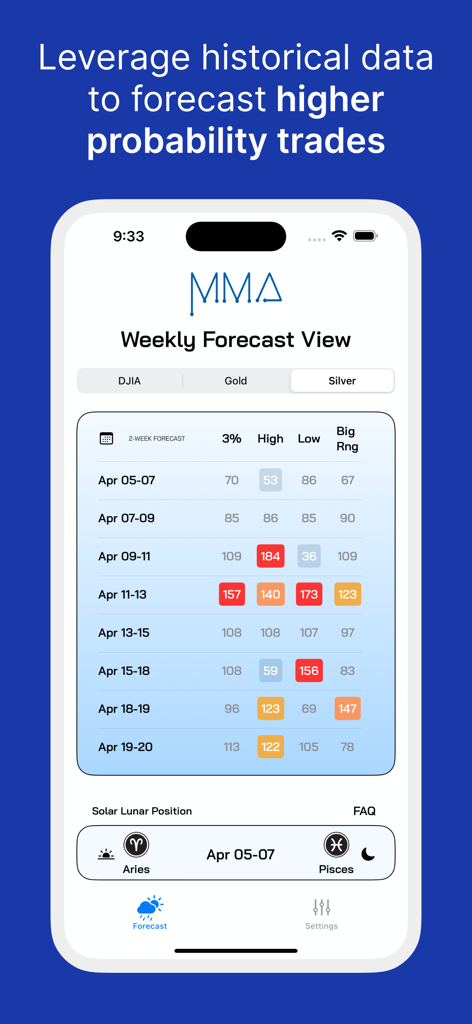
Visualização da Previsão Semanal no aplicativo MMA mostrando pontuações de timing de mercado para Prata com base em posições solares e lunares.
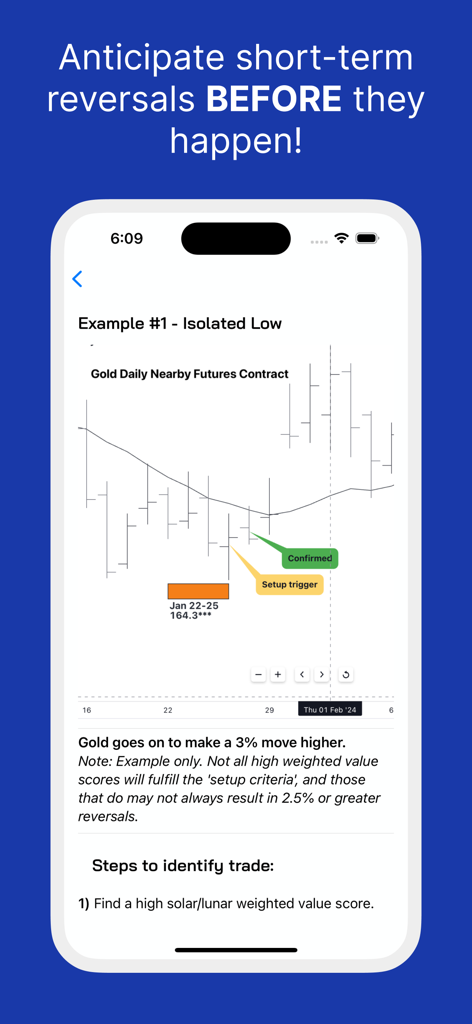
Um gráfico de futuros de ouro mostrando um sinal de reversão isolado no fundo no aplicativo Merriman Market Analyst
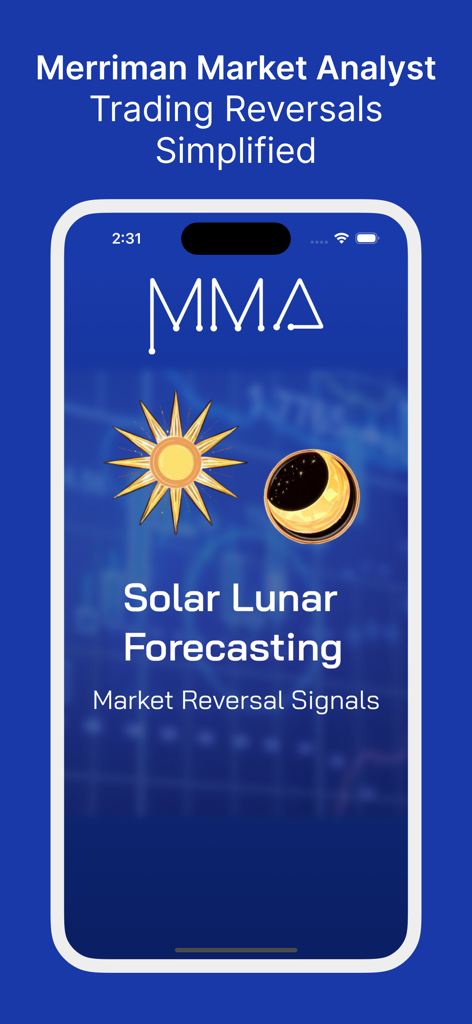
Tela de abertura do aplicativo Merriman Market Analyst com previsão solar lunar e sinais de reversão de mercado
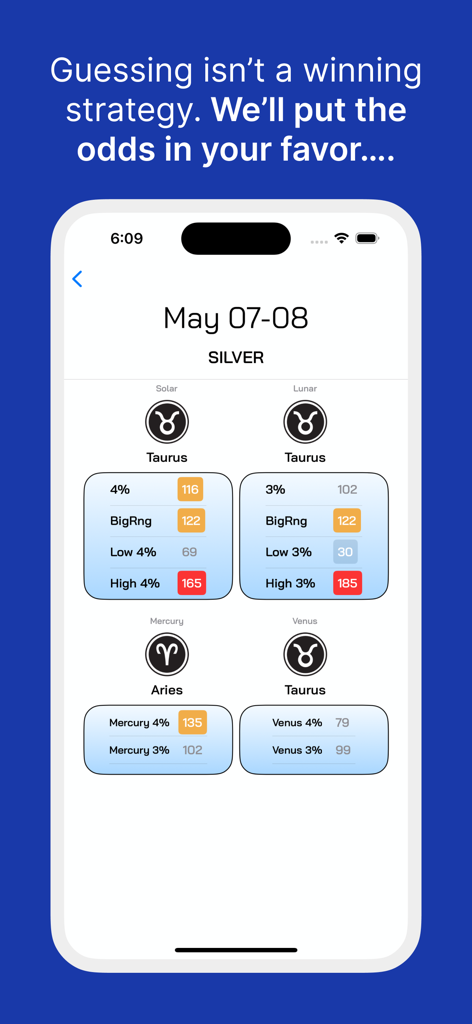
Interface do aplicativo Merriman Market Analyst exibindo pontuações de valor ponderado para negociação de prata com base em ciclos solares e lunares
Descrição
Download
Apps Semelhantes
Apps mais bem classificados na mesma categoria

电子税务局
State Administration of Taxation

UnionPay APP
China Unionpay Co.,Ltd.

养基宝 - 年轻人的养基神器
Shenzhen Xiaoduotou Information Technology Co.,Ltd.

PayPal - Pay, Send, Save
PayPal, Inc.

中国农业银行
AGRICULTURAL BANK OF CHINA LIMITED

Mercado Pago: cuenta digital
MercadoLibre S.A.

Kalshi: Trade on the Big Game
KALSHI INC.

中国工商银行
Industrial and Commercial Bank of China

个人所得税
State Administration of Taxation
Esta página não é uma página oficial do aplicativo ou de seu desenvolvedor, mas uma publicação editorial independente criada para fins informativos e de comentário. Salvo indicação expressa em contrário, nem o aplicativo nem seu desenvolvedor são afiliados, endossados, patrocinados, autorizados ou oficialmente conectados à MWM, Apple, Google Play, ao editor do aplicativo ou ao desenvolvedor do aplicativo, e nada nesta página implica que o aplicativo foi desenvolvido utilizando os serviços da MWM. Todas as marcas comerciais, logotipos, capturas de tela e outros conteúdos permanecem propriedade de seus respectivos proprietários.