Esta página não é uma página oficial do aplicativo ou de seu desenvolvedor, mas uma publicação editorial independente criada para fins informativos e de comentário. Salvo indicação expressa em contrário, nem o aplicativo nem seu desenvolvedor são afiliados, endossados, patrocinados, autorizados ou oficialmente conectados à MWM, Apple, Google Play, ao editor do aplicativo ou ao desenvolvedor do aplicativo, e nada nesta página implica que o aplicativo foi desenvolvido utilizando os serviços da MWM. Todas as marcas comerciais, logotipos, capturas de tela e outros conteúdos permanecem propriedade de seus respectivos proprietários.

Stock Screener Pro - Technical
Pare de verificar gráficos um por um. Combine múltiplos indicadores como MACD, RSI e padrões de Candlestick para filtrar todo o mercado dos EUA em segundos — pesquisa baseada em dados projetada para o seu ritual noturno.
Downloads
100K+Avaliação
Total de avaliações
0Editor
Categoria
FinanceIdiomas
1Última versão
1.6Tamanho
8.6 MBData de lançamento
2 de dez. de 2015Domine o Mercado com Escaneamento Técnico de Precisão
Economize horas de pesquisa manual filtrando milhares de ações dos EUA através de indicadores técnicos avançados sob medida para o swing trader disciplinado.
Escaneamento Poderoso com Múltiplos Indicadores
Combine vários sinais técnicos como MACD, RSI e volume de preço em um único escaneamento para encontrar configurações de trade de alta probabilidade em segundos.
Feito para o seu Ritual Noturno
Perfeito para profissionais ocupados. Use dados confiáveis de fechamento do dia (EOD) para planejar seus trades após o trabalho, sem a pressão do ruído do mercado em tempo real.
As capturas de tela e a descrição a seguir são provenientes diretamente da listagem oficial da loja do aplicativo e são propriedade do desenvolvedor.
App Store
Capturas
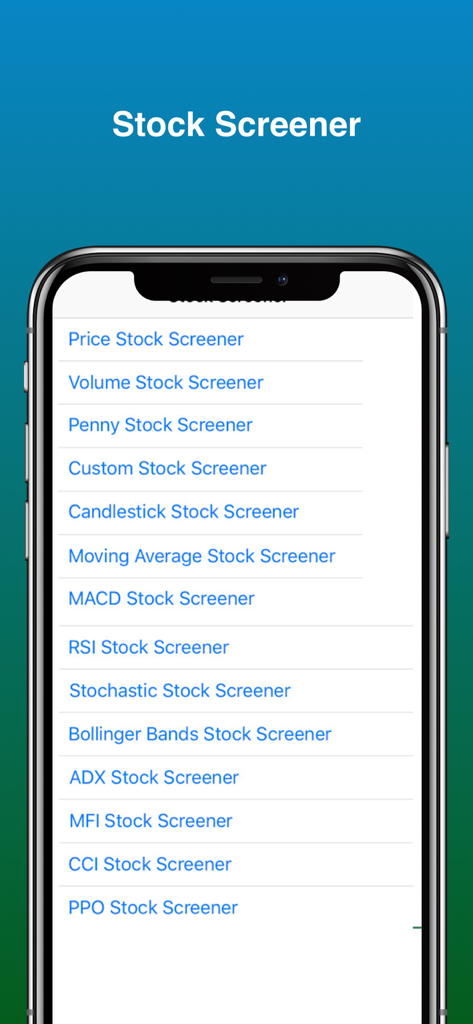
Menu principal do Stock Screener Pro mostrando indicadores de análise técnica como MACD, RSI e Bandas de Bollinger
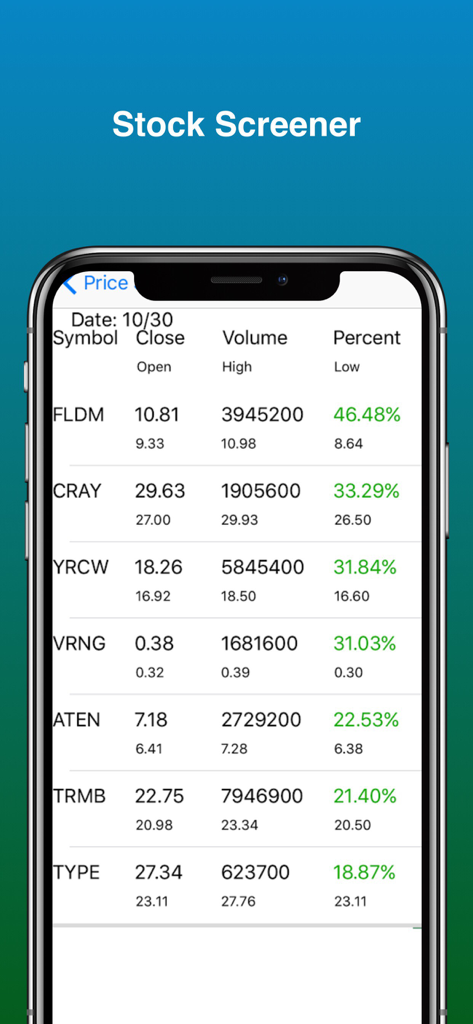
Lista das ações com maiores ganhos com dados de preço e volume no aplicativo Stock Screener Pro
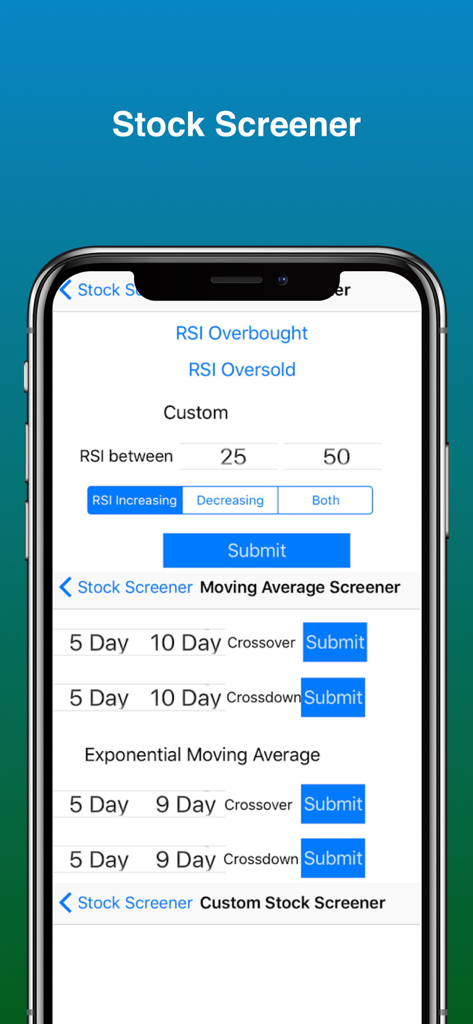
Interface do aplicativo Stock Screener Pro exibindo ferramentas de análise técnica e configurações de filtro de RSI
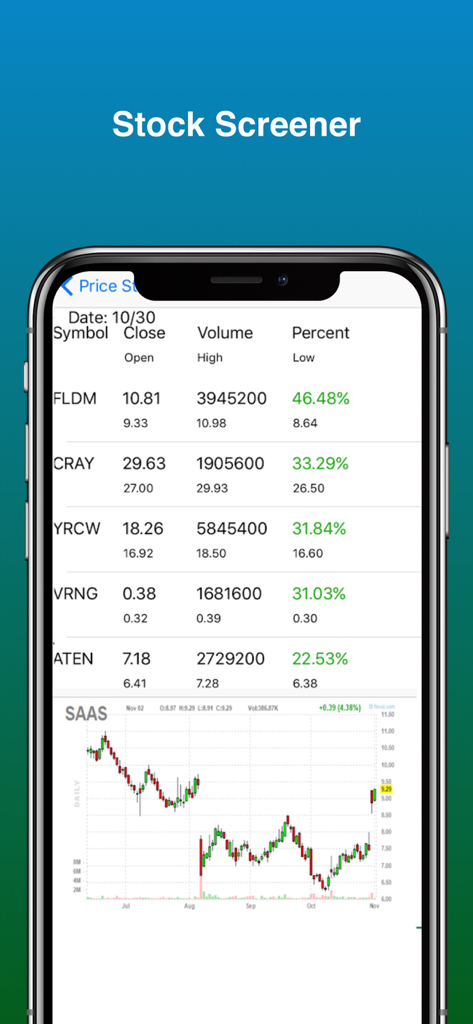
Aplicativo Stock Screener Pro mostrando uma lista de ações e um gráfico técnico de candlestick
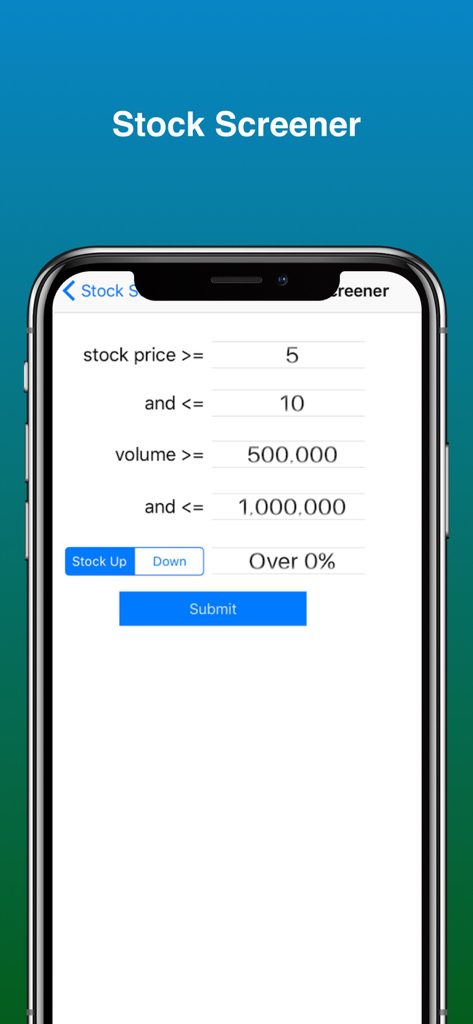
Interface para definir filtros de preço e volume de ações no Stock Screener Pro
Descrição
Download
Apps Semelhantes
Apps mais bem classificados na mesma categoria

电子税务局
State Administration of Taxation

UnionPay APP
China Unionpay Co.,Ltd.

养基宝 - 年轻人的养基神器
Shenzhen Xiaoduotou Information Technology Co.,Ltd.

PayPal - Pay, Send, Save
PayPal, Inc.

中国农业银行
AGRICULTURAL BANK OF CHINA LIMITED

Mercado Pago: cuenta digital
MercadoLibre S.A.

Kalshi: Trade on the Big Game
KALSHI INC.

中国工商银行
Industrial and Commercial Bank of China

个人所得税
State Administration of Taxation
Esta página não é uma página oficial do aplicativo ou de seu desenvolvedor, mas uma publicação editorial independente criada para fins informativos e de comentário. Salvo indicação expressa em contrário, nem o aplicativo nem seu desenvolvedor são afiliados, endossados, patrocinados, autorizados ou oficialmente conectados à MWM, Apple, Google Play, ao editor do aplicativo ou ao desenvolvedor do aplicativo, e nada nesta página implica que o aplicativo foi desenvolvido utilizando os serviços da MWM. Todas as marcas comerciais, logotipos, capturas de tela e outros conteúdos permanecem propriedade de seus respectivos proprietários.