Diese Seite ist keine offizielle Seite der App oder ihres Entwicklers, sondern eine unabhängige redaktionelle Veröffentlichung, die zu Informations- und Kommentarzwecken erstellt wurde. Sofern nicht ausdrücklich anders angegeben, sind weder die App noch ihr Entwickler mit MWM, Apple, Google Play, dem App-Herausgeber oder dem Entwickler der App verbunden, von ihnen unterstützt, gesponsert, autorisiert oder anderweitig offiziell verbunden, und nichts auf dieser Seite impliziert, dass die App unter Verwendung der Dienste von MWM entwickelt wurde. Alle Marken, Logos, Screenshots und andere Inhalte bleiben Eigentum ihrer jeweiligen Inhaber.

Merriman Market Analyst
Meistern Sie die Kunst, Tops und Bottoms zu erkennen. Nutzen Sie historische Solar-/Lunar-Weighted-Value-Scores, um Zonen mit hoher Umkehrwahrscheinlichkeit zu identifizieren und Ihre Trades mit institutioneller Präzision zu timen.
Downloads
100Bewertung
Bewertungen gesamt
0Herausgeber
Kategorie
FinanceSprachen
1Neueste Version
1.0.9Größe
14.1 MBErstveröffentlichung
23. Mai 2024Markt-Timing mit zyklischer Präzision meistern
Nutzen Sie historische Solar-/Lunar-Daten und proprietäre Weighted Value-Scores, um Zonen mit hoher Umkehrwahrscheinlichkeit zu identifizieren, bevor sie eintreten.
Proprietäre WV-Scores
Bewerten Sie sofort die Umkehrwahrscheinlichkeit mit gewichteten Werten, die auf jahrzehntelangen historischen Sonnen-/Mondkorrelationsstudien basieren.
Präzise Umkehr-Alerts
Bleiben Sie dem Trend voraus mit Benachrichtigungen, wenn WV-Scores 138 überschreiten, was die höchste Wahrscheinlichkeit für eine Marktbewegung von 3 % signalisiert.
Die folgenden Screenshots und die Beschreibung stammen direkt aus dem offiziellen Store-Eintrag der App und sind Eigentum des Entwicklers.
App Store
Screenshots
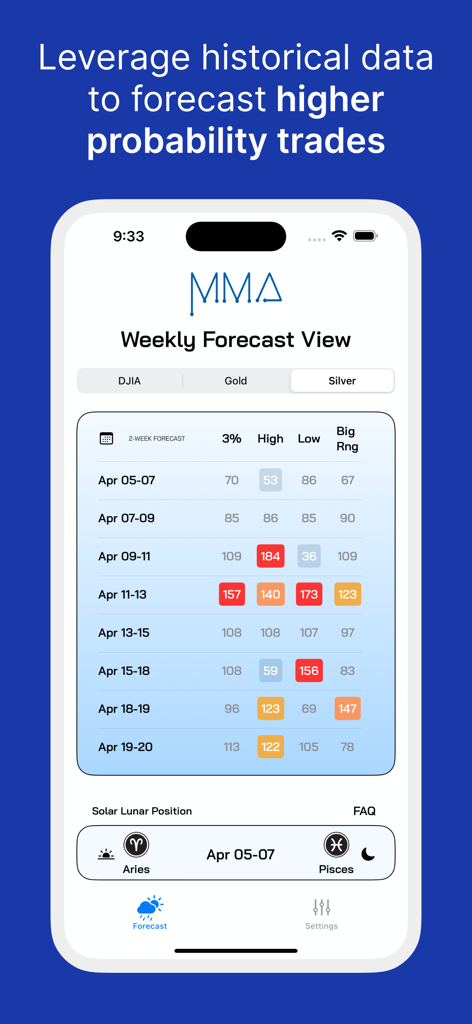
Wöchentliche Prognoseansicht in der MMA-App mit Markt-Timing-Scores für Silber basierend auf Sonnen- und Mondpositionen.
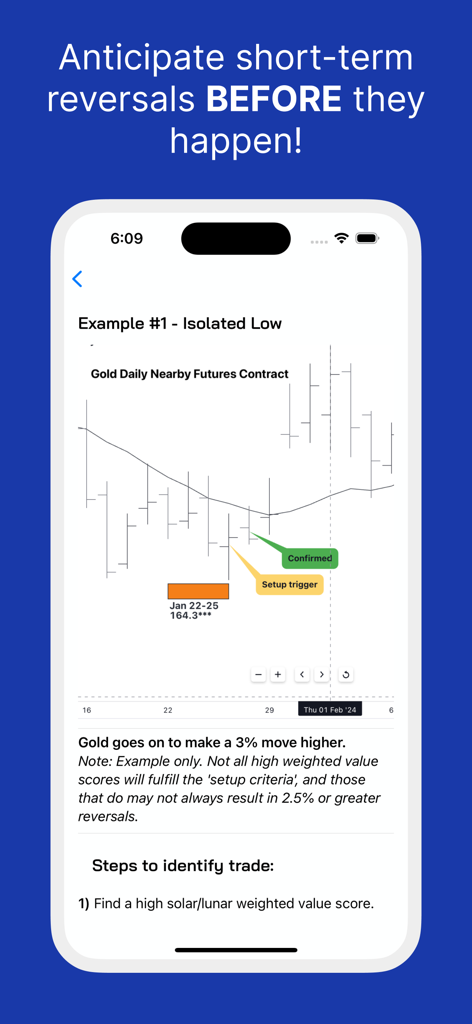
Ein Gold-Futures-Chart, der ein isoliertes Tiefumkehrsignal in der Merriman Market Analyst-App zeigt
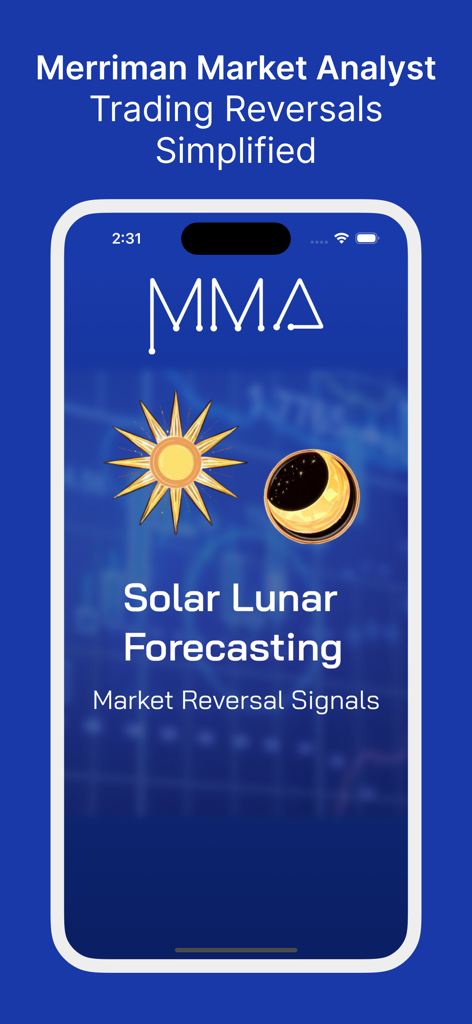
Merriman Market Analyst App-Startbildschirm mit Solar-Lunar-Prognosen und Marktumkehrsignalen
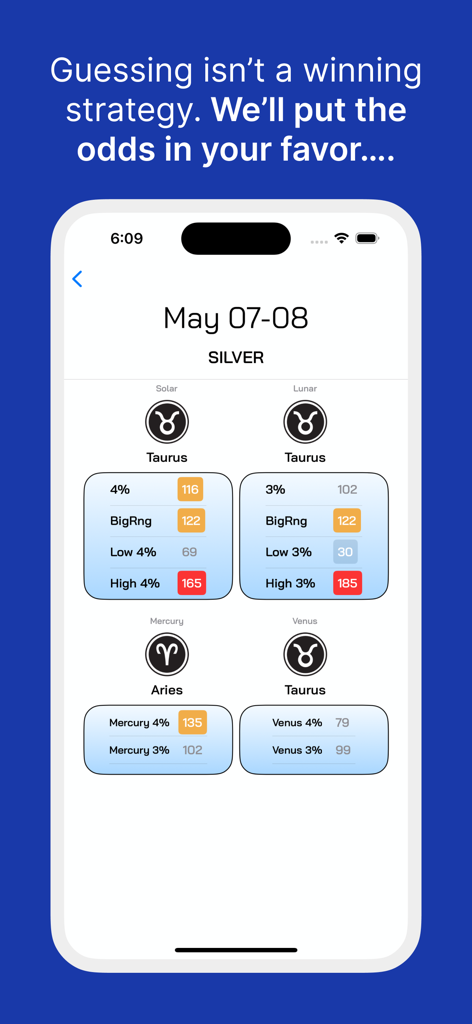
Merriman Market Analyst App-Oberfläche, die gewichtete Wert-Scores für den Silberhandel basierend auf Sonnen- und Mondzyklen anzeigt
Beschreibung
Download
Ähnliche Apps
Top-gerankte Apps in derselben Kategorie

电子税务局
State Administration of Taxation

UnionPay APP
China Unionpay Co.,Ltd.

养基宝 - 年轻人的养基神器
Shenzhen Xiaoduotou Information Technology Co.,Ltd.

PayPal - Pay, Send, Save
PayPal, Inc.

中国农业银行
AGRICULTURAL BANK OF CHINA LIMITED

Mercado Pago: cuenta digital
MercadoLibre S.A.

Kalshi: Trade on the Big Game
KALSHI INC.

中国工商银行
Industrial and Commercial Bank of China

个人所得税
State Administration of Taxation
Diese Seite ist keine offizielle Seite der App oder ihres Entwicklers, sondern eine unabhängige redaktionelle Veröffentlichung, die zu Informations- und Kommentarzwecken erstellt wurde. Sofern nicht ausdrücklich anders angegeben, sind weder die App noch ihr Entwickler mit MWM, Apple, Google Play, dem App-Herausgeber oder dem Entwickler der App verbunden, von ihnen unterstützt, gesponsert, autorisiert oder anderweitig offiziell verbunden, und nichts auf dieser Seite impliziert, dass die App unter Verwendung der Dienste von MWM entwickelt wurde. Alle Marken, Logos, Screenshots und andere Inhalte bleiben Eigentum ihrer jeweiligen Inhaber.