Diese Seite ist keine offizielle Seite der App oder ihres Entwicklers, sondern eine unabhängige redaktionelle Veröffentlichung, die zu Informations- und Kommentarzwecken erstellt wurde. Sofern nicht ausdrücklich anders angegeben, sind weder die App noch ihr Entwickler mit MWM, Apple, Google Play, dem App-Herausgeber oder dem Entwickler der App verbunden, von ihnen unterstützt, gesponsert, autorisiert oder anderweitig offiziell verbunden, und nichts auf dieser Seite impliziert, dass die App unter Verwendung der Dienste von MWM entwickelt wurde. Alle Marken, Logos, Screenshots und andere Inhalte bleiben Eigentum ihrer jeweiligen Inhaber.

Smith Charts
Beschleunigen Sie Ihren Labor-Workflow mit hochpräziser Impedanzanpassung, Touchstone-Datei-Unterstützung und erweiterter Geräteanalyse. Erleben Sie eine leistungsstarke interaktive Umgebung, optimiert für Ingenieure auf iPhone, iPad und Mac.
Downloads
6K+Bewertung
Bewertungen gesamt
0Herausgeber
Kategorie
ProductivitySprachen
1Neueste Version
3.0.1Größe
24.2 MBErstveröffentlichung
29. Dez. 2021Präzisions-HF-Technik auf Knopfdruck
Verabschieden Sie sich von Papierdiagrammen und nutzen Sie eine leistungsstarke digitale Suite. Unsere App wurde für HF-Profis und Ingenieure entwickelt und bietet einen nahtlosen Workflow für das Design von Anpassnetzwerken und die Analyse komplexer Geräte auf iPhone, iPad und Mac.
Interaktives digitales Diagramm
Ersetzen Sie Bleistifte und Zirkel durch hochpräzise Touch-Gesten. Ziehen, zoomen und verwenden Sie das integrierte digitale Lineal, um Wellenlängen, Koordinaten und Impedanzen in jeder Umgebung sofort zu erhalten.
Erweiterte Netzwerksynthese
Entwerfen Sie komplexe Anpassnetzwerke mit L, C, R und Übertragungsleitungen. Simulieren Sie Parasiten und verfolgen Sie Impedanzverschiebungen in Echtzeit während des Aufbaus, um sicherzustellen, dass Ihr Design die Spezifikationen erfüllt, bevor Sie es auf der Werkbank testen.
Die folgenden Screenshots und die Beschreibung stammen direkt aus dem offiziellen Store-Eintrag der App und sind Eigentum des Entwicklers.
App Store
Screenshots
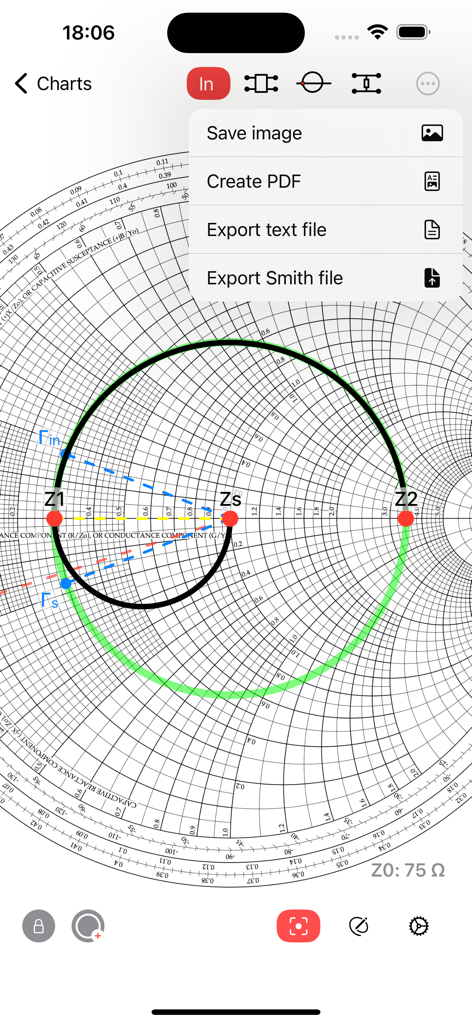
Smith Charts App zeigt Exportoptionen einschließlich PDF und Textdatei über einer Impedanzdarstellung in einem Smith-Diagramm.
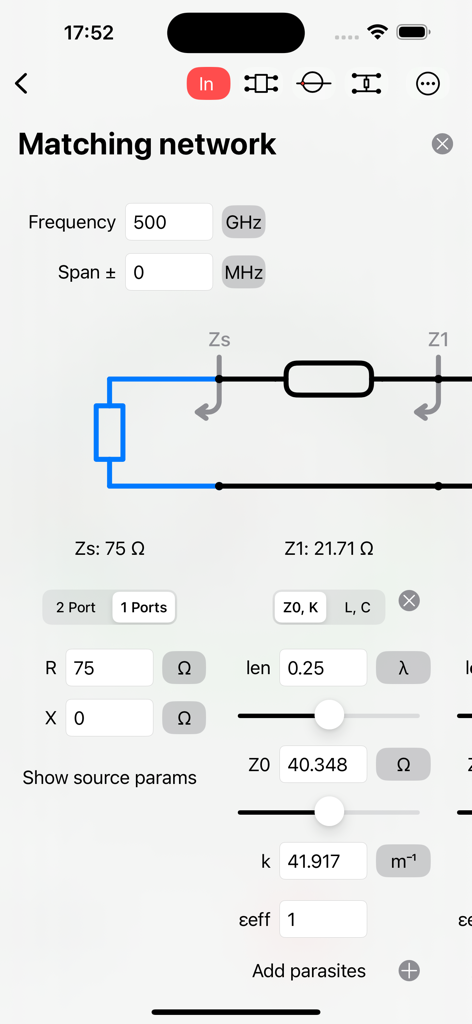
Benutzeroberfläche der Smith Charts App mit Werkzeugen für das Design von Anpassnetzwerken und Schaltkreiskomponenten.
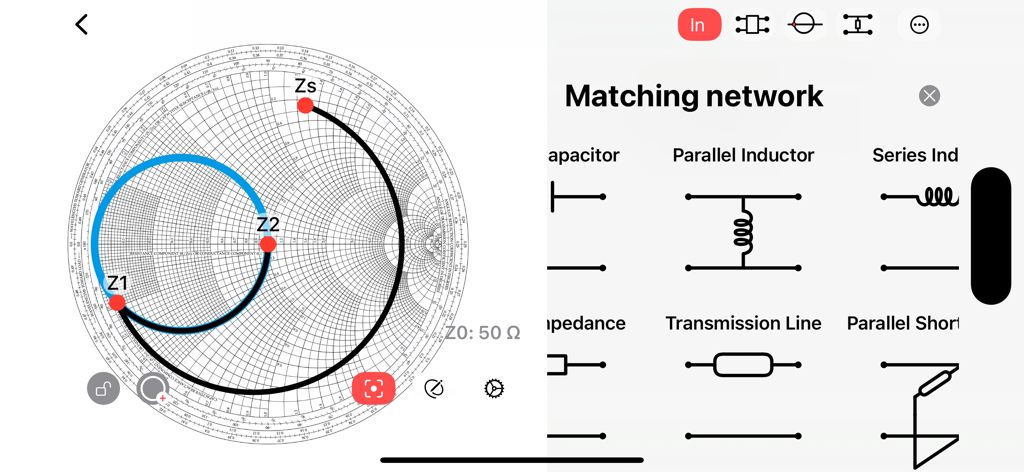
Smith Chart App-Oberfläche, die ein Design für ein Anpassnetzwerk mit Impedanzpunkten und einer Menüauswahl für Komponenten zeigt.
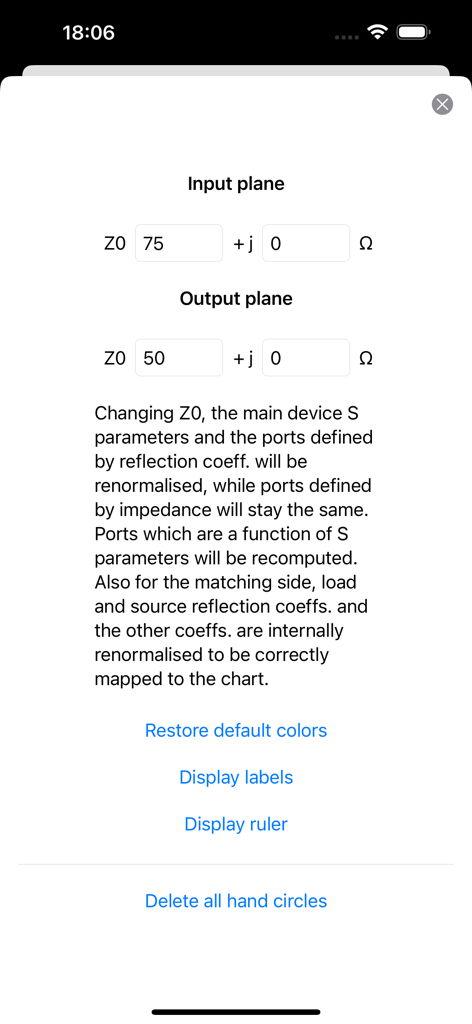
Einstellungsbildschirm zur Konfiguration von Eingangs- und Ausgangsebene-Impedanzwerten in der Smith Charts App.
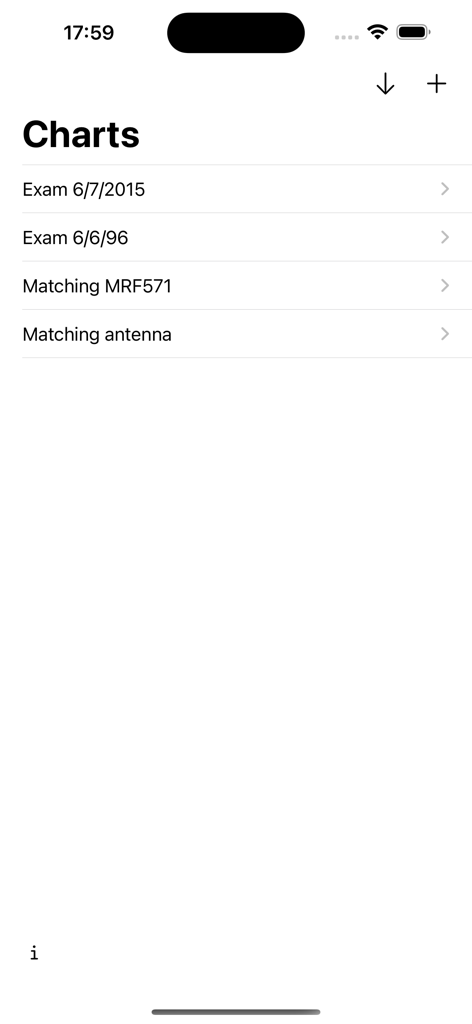
Eine Listenansicht, die gespeicherte Smith-Diagramm-Projekte zeigt, einschließlich Antennenanpassung und Prüfungsdateien.
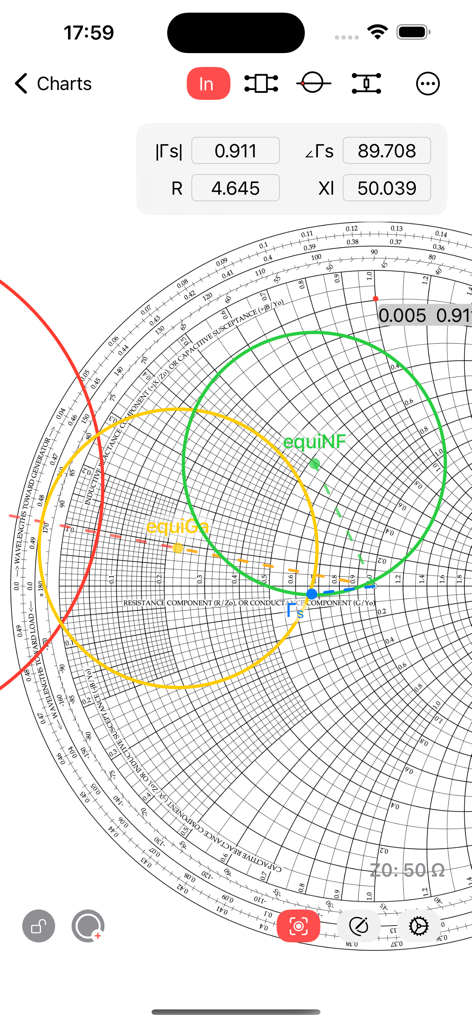
Smith Charts App-Oberfläche, die gleichmäßige Verstärkungs- und Rauschkreise für das Design von Hochfrequenztechnik zeigt.
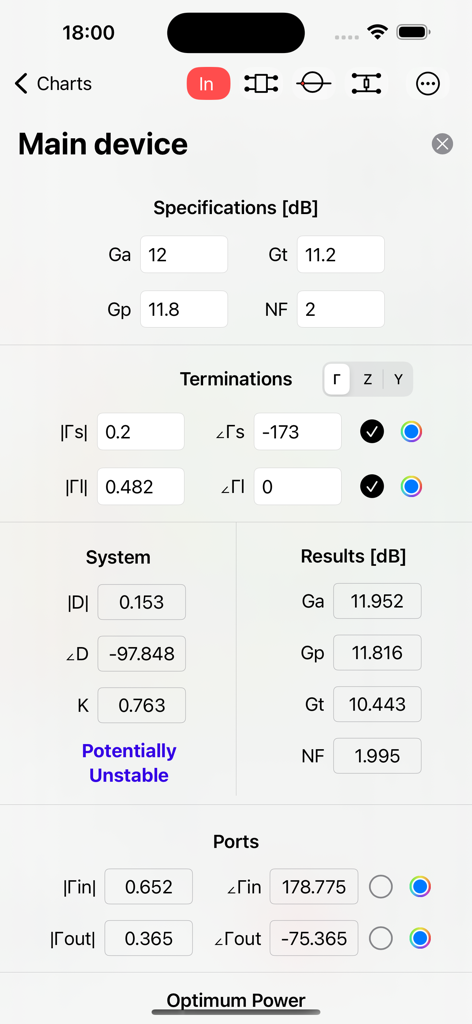
Detaillierte Ansicht von HF-Geräteparametern, einschließlich Verstärkungsspezifikationen und Stabilitätsanalyse in der Smith Charts App.
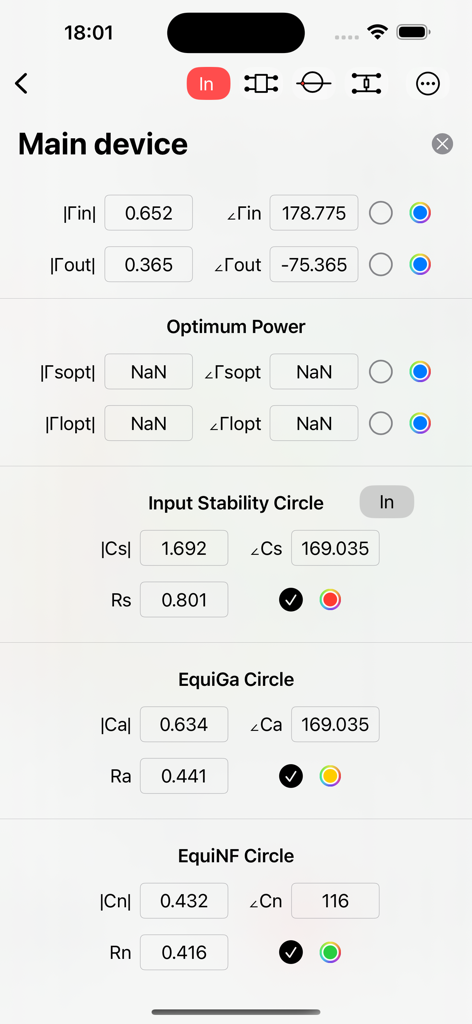
Screenshot der Smith Charts App, der numerische Daten für Eingangs-Stabilitäts- und Rauschkreise für die HF-Technik zeigt.
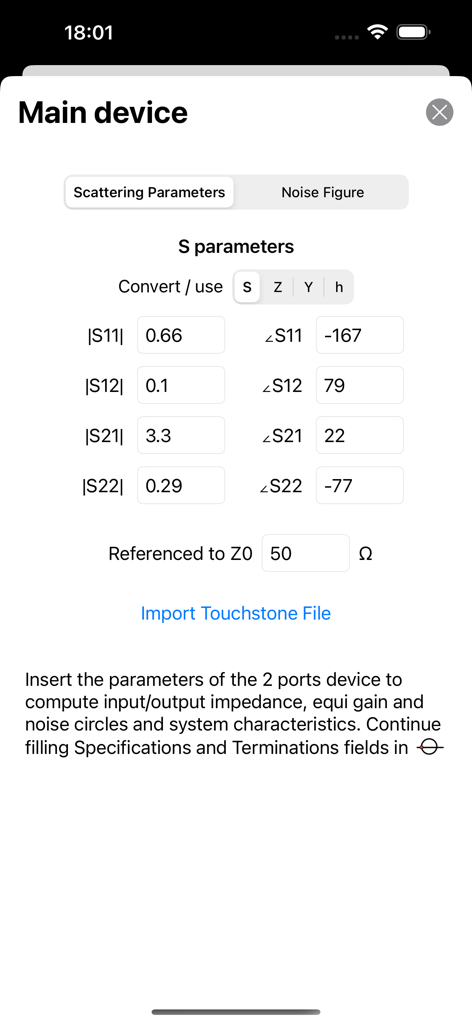
Oberfläche zur Eingabe von Streuparametern und zum Import von Touchstone-Dateien in der Smith Charts App.
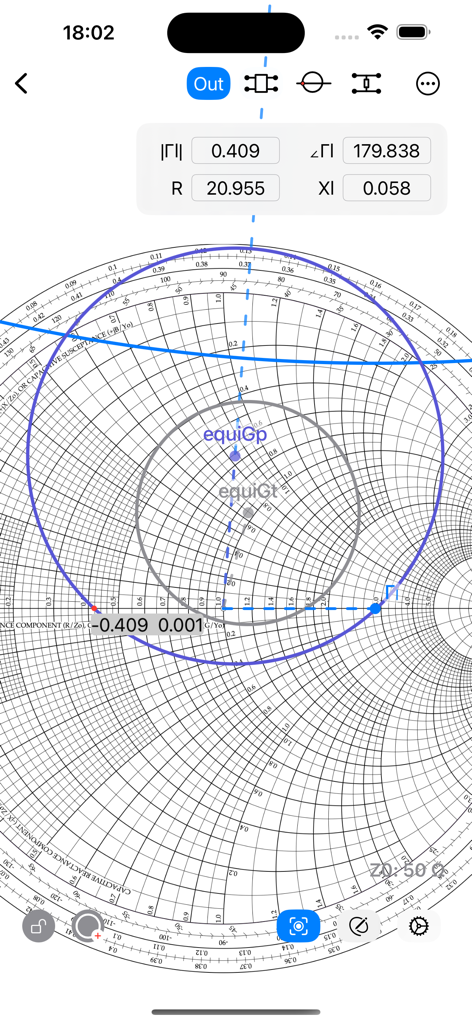
Digitale Smith-Diagramm-Oberfläche, die komplexe Impedanzkoordinaten und Leistungsverstärkungskreise für die HF-Technik zeigt.
Beschreibung
Download
Ähnliche Apps
Top-gerankte Apps in derselben Kategorie

ChatGPT
OpenAI OpCo, LLC

Google Gemini
Google LLC

Grok
X.AI Corporation

Gmail - Email by Google
Google LLC

千问 - 阿里最强大模型官方AI助手
Shanghai Zhixin Puhui Technology Co., Ltd.

Google Drive
Google LLC

Microsoft Authenticator
Microsoft Corporation

Google Sheets
Google LLC

Google Docs
Google LLC
Diese Seite ist keine offizielle Seite der App oder ihres Entwicklers, sondern eine unabhängige redaktionelle Veröffentlichung, die zu Informations- und Kommentarzwecken erstellt wurde. Sofern nicht ausdrücklich anders angegeben, sind weder die App noch ihr Entwickler mit MWM, Apple, Google Play, dem App-Herausgeber oder dem Entwickler der App verbunden, von ihnen unterstützt, gesponsert, autorisiert oder anderweitig offiziell verbunden, und nichts auf dieser Seite impliziert, dass die App unter Verwendung der Dienste von MWM entwickelt wurde. Alle Marken, Logos, Screenshots und andere Inhalte bleiben Eigentum ihrer jeweiligen Inhaber.