Diese Seite ist keine offizielle Seite der App oder ihres Entwicklers, sondern eine unabhängige redaktionelle Veröffentlichung, die zu Informations- und Kommentarzwecken erstellt wurde. Sofern nicht ausdrücklich anders angegeben, sind weder die App noch ihr Entwickler mit MWM, Apple, Google Play, dem App-Herausgeber oder dem Entwickler der App verbunden, von ihnen unterstützt, gesponsert, autorisiert oder anderweitig offiziell verbunden, und nichts auf dieser Seite impliziert, dass die App unter Verwendung der Dienste von MWM entwickelt wurde. Alle Marken, Logos, Screenshots und andere Inhalte bleiben Eigentum ihrer jeweiligen Inhaber.

Stock+: Stock Market Heat Map
Hören Sie auf, endlose Tickerlisten zu durchsuchen. Identifizieren Sie Marktführer sofort mit interaktiven Treemaps, professionellen technischen Indikatoren und detaillierten Sektoranalysen, die für den datengesteuerten Investor entwickelt wurden.
Downloads
2K+Bewertung
Bewertungen gesamt
100Herausgeber
Kategorie
FinanceSprachen
3Neueste Version
3.10.0Größe
21.2 MBErstveröffentlichung
15. Jan. 2024Beherrschen Sie den Markt auf einen Blick
Hören Sie auf, endlose Tickerlisten zu durchsuchen. Nutzen Sie interaktive Heatmaps und professionelle technische Indikatoren, um Trends zu visualisieren und in Sekundenschnelle fundierte Entscheidungen zu treffen.
Interaktive Markt-Heatmaps
Erfassen Sie sofort die Marktstimmung. Visualisieren Sie den S&P 500, Nasdaq und Dow Jones durch farbcodierte Treemaps, skaliert nach Marktkapitalisierung.
Einblicke in die Sektorrotation
Tauchen Sie tief in bestimmte Sektoren und Branchen ein, um führende und nachfolgende Unternehmen zu identifizieren. Verstehen Sie in Echtzeit, wohin das Geld fließt.
Die folgenden Screenshots und die Beschreibung stammen direkt aus dem offiziellen Store-Eintrag der App und sind Eigentum des Entwicklers.
App Store
Screenshots
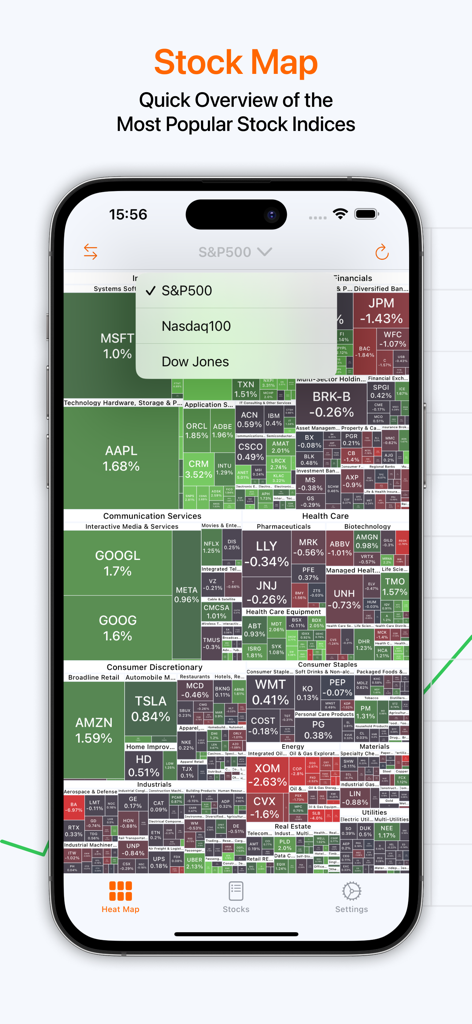
Interaktive Heatmap des S&P 500 Index, die die Aktienperformance nach Sektoren in einer mobilen App zeigt.
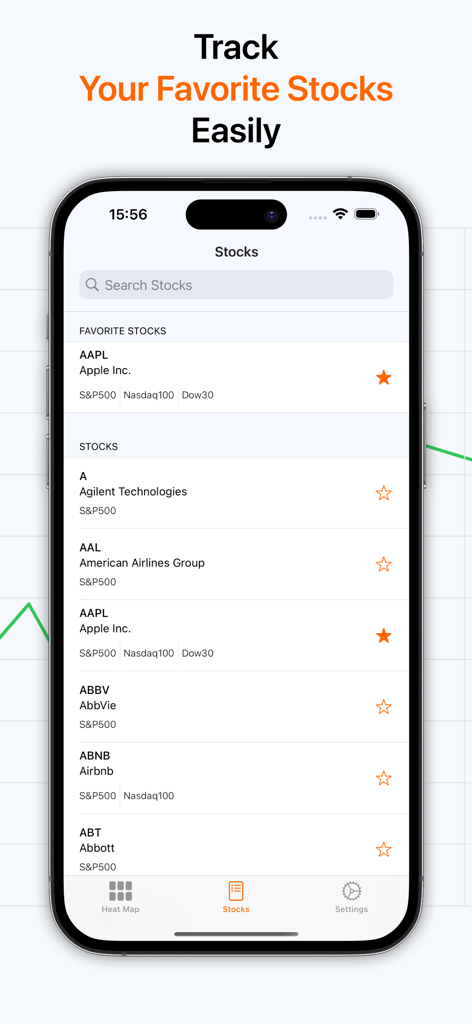
Oberfläche einer mobilen App, die eine Liste von bevorzugten Aktien und eine Suchleiste zur Verfolgung der Marktperformance anzeigt.
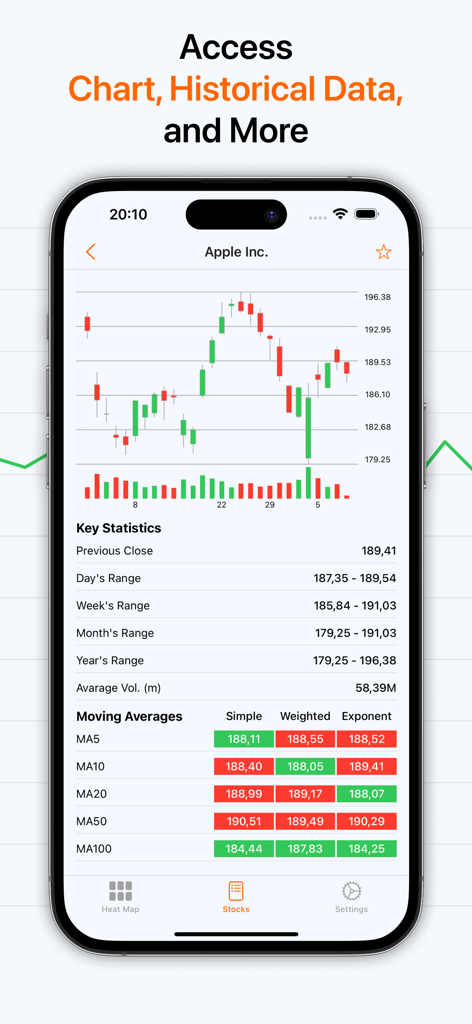
Detaillierte Ansicht der technischen Aktienanalyse mit Candlestick-Chart und Tabelle der gleitenden Durchschnitte
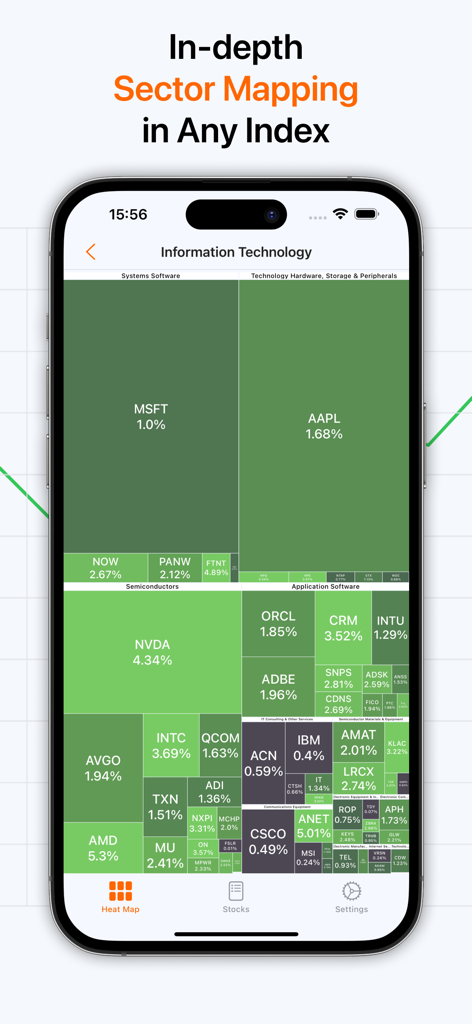
Ein Screenshot einer mobilen App, der eine interaktive Heatmap für Aktien im Informationstechnologie-Sektor anzeigt
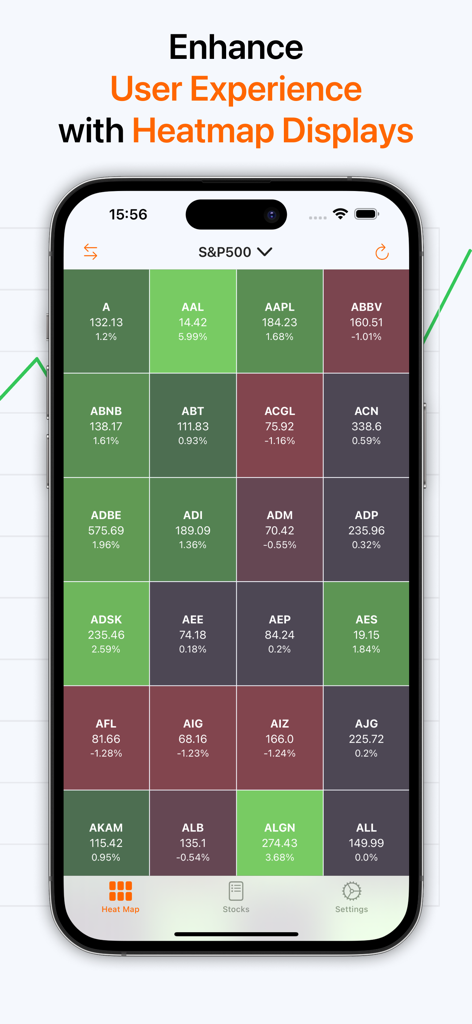
Die Benutzeroberfläche einer mobilen App, die eine farbcodierte Heatmap des Aktienmarktes für den S&P 500 anzeigt.
Beschreibung
Download
Ähnliche Apps
Top-gerankte Apps in derselben Kategorie

电子税务局
State Administration of Taxation

UnionPay APP
China Unionpay Co.,Ltd.

养基宝 - 年轻人的养基神器
Shenzhen Xiaoduotou Information Technology Co.,Ltd.

PayPal - Pay, Send, Save
PayPal, Inc.

中国农业银行
AGRICULTURAL BANK OF CHINA LIMITED

Mercado Pago: cuenta digital
MercadoLibre S.A.

Kalshi: Trade on the Big Game
KALSHI INC.

中国工商银行
Industrial and Commercial Bank of China

个人所得税
State Administration of Taxation
Diese Seite ist keine offizielle Seite der App oder ihres Entwicklers, sondern eine unabhängige redaktionelle Veröffentlichung, die zu Informations- und Kommentarzwecken erstellt wurde. Sofern nicht ausdrücklich anders angegeben, sind weder die App noch ihr Entwickler mit MWM, Apple, Google Play, dem App-Herausgeber oder dem Entwickler der App verbunden, von ihnen unterstützt, gesponsert, autorisiert oder anderweitig offiziell verbunden, und nichts auf dieser Seite impliziert, dass die App unter Verwendung der Dienste von MWM entwickelt wurde. Alle Marken, Logos, Screenshots und andere Inhalte bleiben Eigentum ihrer jeweiligen Inhaber.