このページはアプリまたはその開発者の公式ページではなく、情報提供および論評を目的として作成された独立した編集出版物です。明示的に別段の記載がない限り、アプリおよびその開発者は、MWM、Apple、Google Play、アプリのパブリッシャー、またはアプリの開発者と提携、承認、後援、認可、またはその他の公式的な関係はなく、このページのいかなる内容も、アプリがMWMのサービスを使用して開発されたことを意味するものではありません。すべての商標、ロゴ、スクリーンショット、その他のコンテンツはそれぞれの所有者の財産です。

Easy Dashboard for Indicators
手動でのチャートスキャンに何時間も費やすのはやめましょう。市場の俯瞰図を手に入れ、カスタマイズ可能なアラートを受け取ることで、外出先でも取引の機会を逃しません。
ダウンロード
20K+ユーザー評価
評価数
1K+開発元
カテゴリ
Finance対応言語
1最新バージョン
5.4.1サイズ
96.5 MBリリース日
2017年9月7日プロフェッショナルな明確さで市場をマスターする
散らかったチャートとの格闘はやめましょう。インテリジェントなダッシュボードは、複雑な市場データを実行可能な洞察に凝縮し、どこからでも自信を持って取引できるようにします。
オールインワン ダッシュボード
単一の画面で複数のテクニカルインジケーターと通貨ペアを監視し、分析の麻痺を排除し、一目でトレンドを特定します。
スマート アラート+
特定の戦略パラメータに基づいて完全にカスタマイズ可能な通知を設定し、外出先でも高確率のセットアップを見逃さないようにします。
以下のスクリーンショットと説明は、アプリの公式ストアリスティングから直接取得されたものであり、アプリ開発者の所有物です。
アプリストア
スクリーンショット
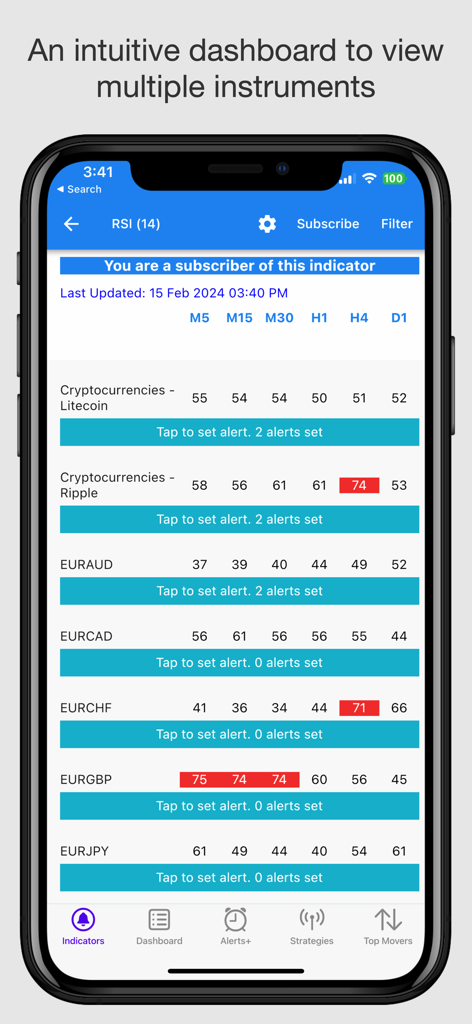
Easy Dashboard アプリインターフェースは、さまざまな時間枠にわたる複数の金融商品の RSI テクニカルインジケーター値を示しています
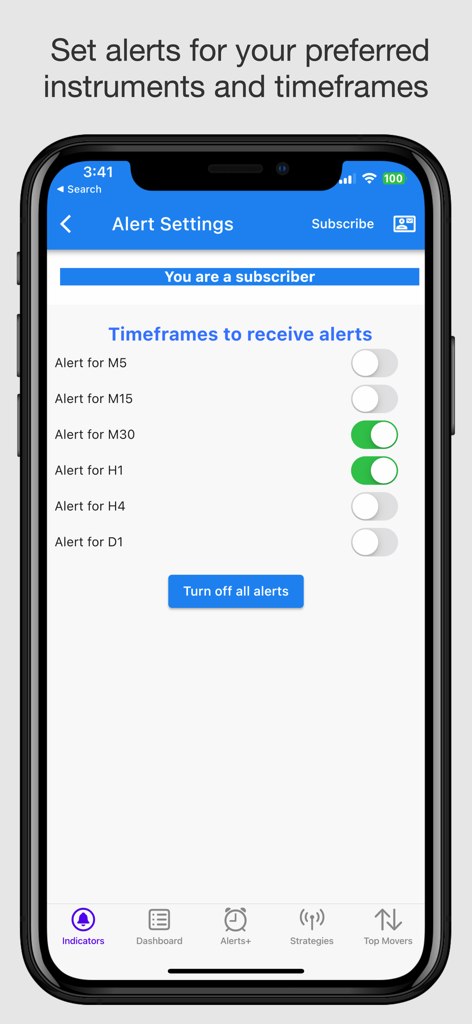
さまざまな時間枠にわたる複数の取引インジケーター通知をカスタマイズするためのアラート設定画面。
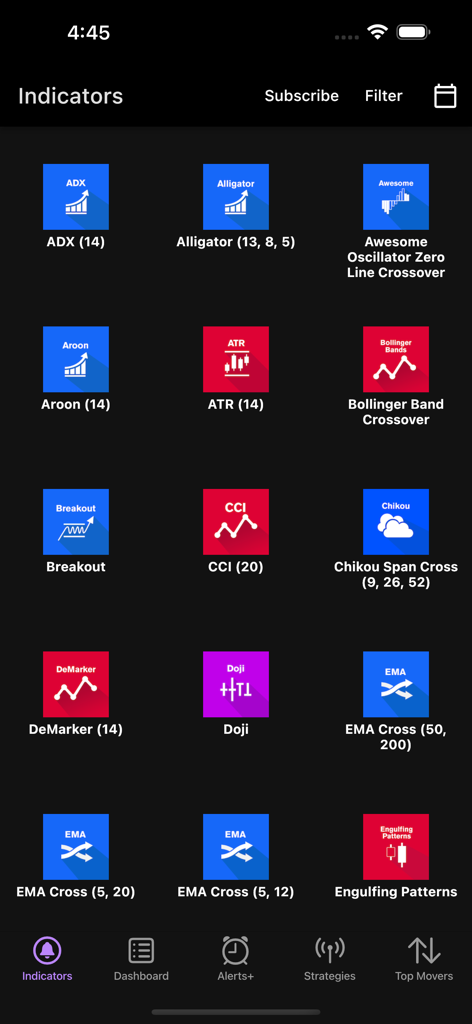
ADX、アリゲーター、ボリンジャーバンドのクロスオーバーなどのテクニカル取引インジケーターのリストを表示するモバイル画面
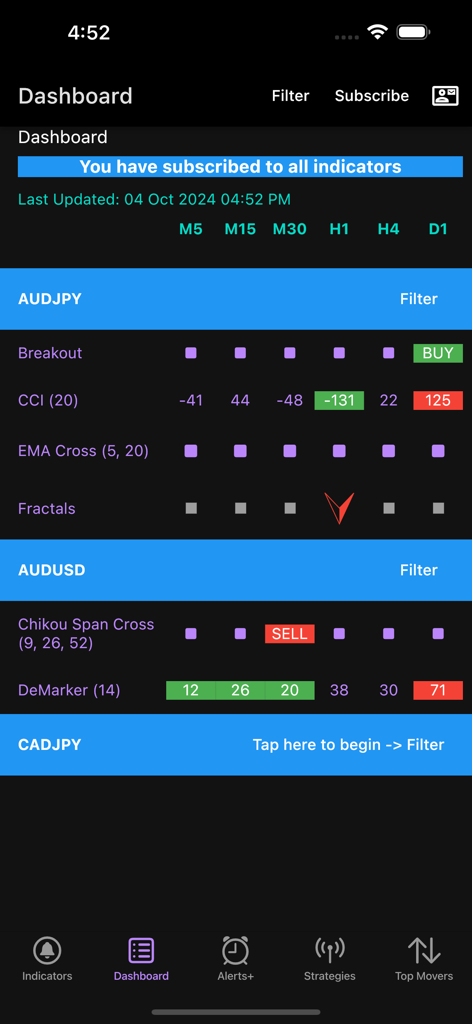
AUDUSD や EURNZD などの通貨ペアのリアルタイムテクニカルインジケーターを表示するモバイルダッシュボード
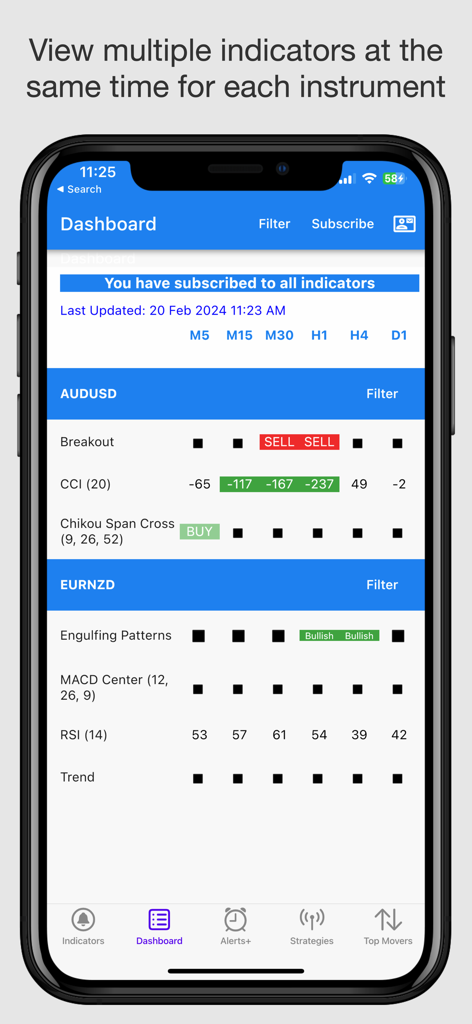
AUDUSD や EURNZD などの通貨ペアの複数のテクニカル取引インジケーターを表示するモバイルダッシュボード
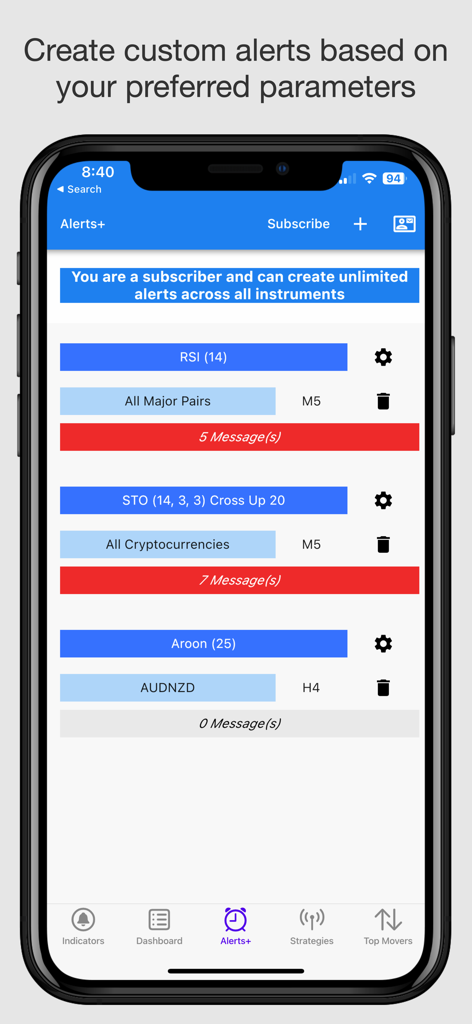
カスタム取引インジケーター通知のための Alerts plus 機能を示すモバイルアプリインターフェース。
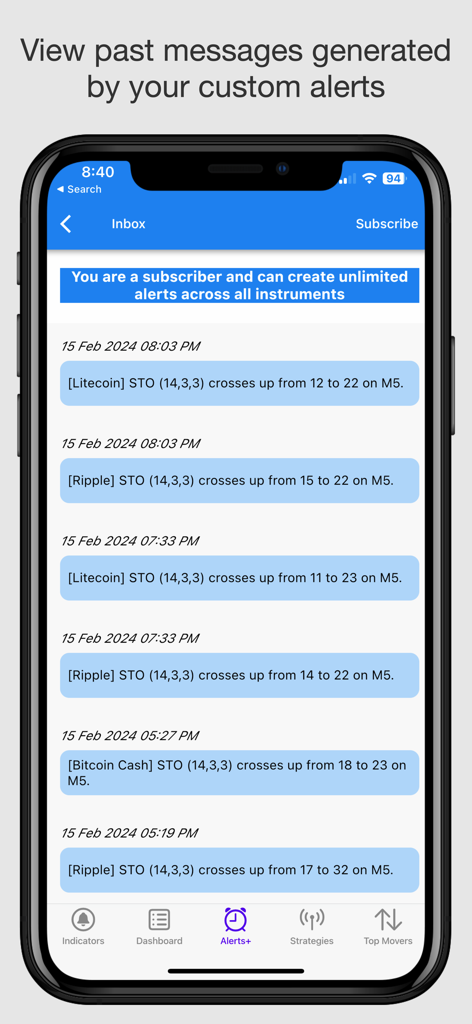
暗号通貨インジケーターの過去の取引アラートのリストを示すモバイルアプリ画面
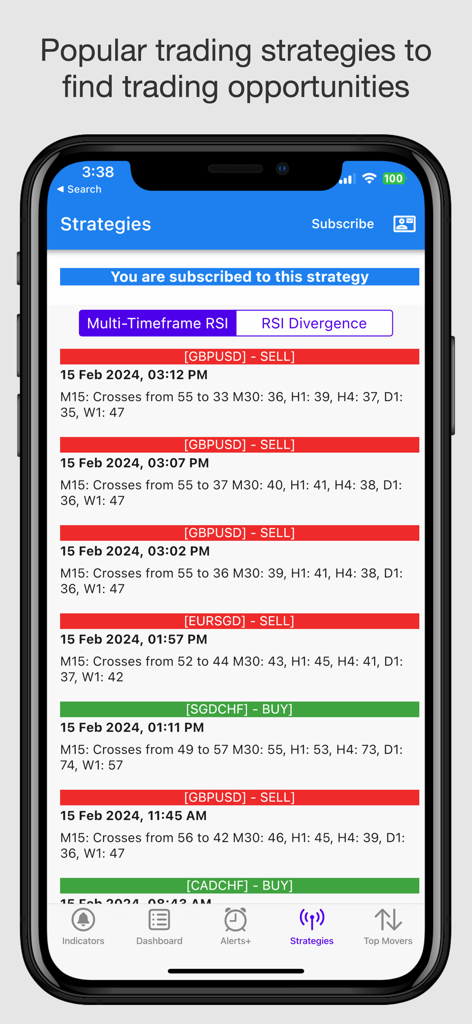
Easy Dashboard モバイルアプリ画面は、一般的な取引戦略に基づいたさまざまな通貨ペアの売買シグナルを示しています
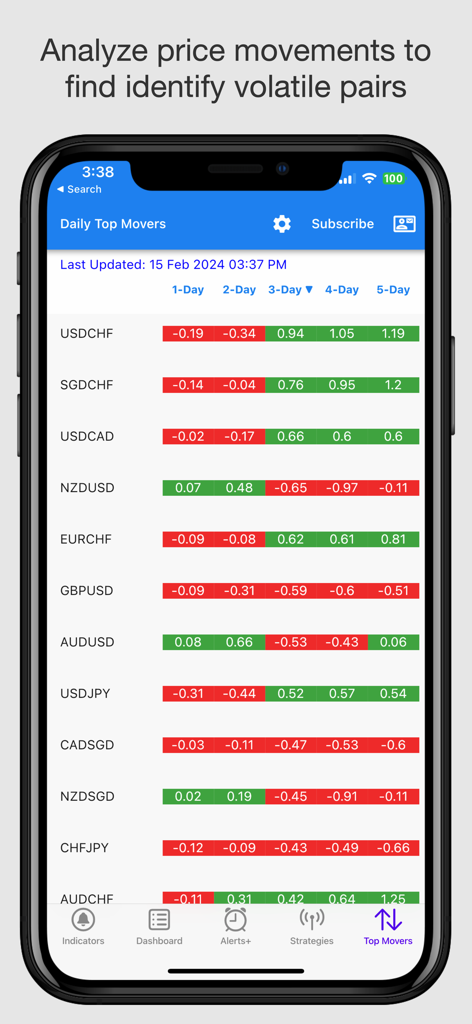
複数日間の価格変動を伴う外国為替通貨ペアの毎日のトップムーバーを表示するモバイルアプリインターフェース
説明
Download
類似アプリ
似た機能とユーザー体験を持つアプリ

Into the Cryptoverse
BC Analytics, LLC

Questrade Edge Mobile
Questrade Inc.

Realtime Stock Screener
Maxim Golokhov

Flow Greeks : Unusual Options
Flow Greeks LLC

Unusual Whales
Unusual Whales Inc

Super Stocks with Options
Mobile Interactive LLC

Ave Pro
AVE AI DATA AU TECHNOLOGY PTY LTD

Option Signal Alert
KYOTO K.K.

OptionsFlow
Asian Digital Mind Limited
このページはアプリまたはその開発者の公式ページではなく、情報提供および論評を目的として作成された独立した編集出版物です。明示的に別段の記載がない限り、アプリおよびその開発者は、MWM、Apple、Google Play、アプリのパブリッシャー、またはアプリの開発者と提携、承認、後援、認可、またはその他の公式的な関係はなく、このページのいかなる内容も、アプリがMWMのサービスを使用して開発されたことを意味するものではありません。すべての商標、ロゴ、スクリーンショット、その他のコンテンツはそれぞれの所有者の財産です。