このページはアプリまたはその開発者の公式ページではなく、情報提供および論評を目的として作成された独立した編集出版物です。明示的に別段の記載がない限り、アプリおよびその開発者は、MWM、Apple、Google Play、アプリのパブリッシャー、またはアプリの開発者と提携、承認、後援、認可、またはその他の公式的な関係はなく、このページのいかなる内容も、アプリがMWMのサービスを使用して開発されたことを意味するものではありません。すべての商標、ロゴ、スクリーンショット、その他のコンテンツはそれぞれの所有者の財産です。

IQAir AirVisual | Air Quality
世界で最も信頼されているAQIデータで健康を守りましょう。野火の煙や花粉数から7日間の予測まで、屋外トレーニングの計画や家族の安全確保に必要な正確なインサイトを提供します。
ダウンロード
7M+ユーザー評価
評価数
256K+開発元
カテゴリ
Weather対応言語
20最新バージョン
7.2.7サイズ
196.5 MBリリース日
2015年10月24日リアルタイムの空気質インサイトで健康を増進
野火の煙から季節の花粉まで、世界で最も信頼されている空気質データを取得して、家族を守り、屋外活動を最適化しましょう。
一日の健康的なプランを
7日間の大気汚染と天気予報を活用して、空気が最もきれいな時間にランニング、サイクリング、屋外遊びのスケジュールを立てましょう。
パーソナライズされた保護
敏感なグループ向けにカスタマイズされた実行可能な健康推奨事項を受け取り、喘息やアレルギーを自信を持って管理しましょう。
よくある質問
について知っておくべきこと IQAir AirVisual | Air Quality
What is IQAir AirVisual | Air Quality?
IQAir AirVisual | Air Qualityは、政府の監視ステーションとIQAirの検証済みセンサーのグローバルネットワークからの信頼できる空気質情報を提供します。50万以上の場所をカバーしています。
Who is the IQAir AirVisual app recommended for?
IQAir AirVisualアプリは、敏感な人々(アレルギー、喘息)、家族、アスリート、ランナー、サイクリスト、および屋外スポーツ活動を行う個人に推奨されます。これにより、より健康的な一日を計画することができます。
Does the IQAir AirVisual app provide air quality forecasts?
はい、IQAir AirVisualアプリは48時間の空気汚染予測と7日間の空気汚染および天気予報を提供します。これにより、ユーザーはより健康的な体験のために屋外活動を計画することができます。
Can IQAir AirVisual users track wildfire events?
はい、IQAir AirVisualアプリは、世界中の山火事や空気質のイベントについてユーザーに通知します。リアルタイムおよび過去のデータを含むインタラクティブマップでアラートを提供し、追跡を可能にします。
Does the IQAir AirVisual app show pollen counts?
はい、IQAir AirVisualアプリは、お気に入りの場所の樹木、雑草、草の花粉数を表示します。また、アレルギーの管理や屋外活動の効果的な計画を支援するために、3日間の予報も提供します。
What air pollutants does IQAir AirVisual monitor?
IQAir AirVisualアプリは、PM2.5、PM10、オゾン、二酸化窒素、二酸化硫黄、一酸化炭素を追跡します。これらの主要な汚染物質のリアルタイム濃度と過去の傾向を表示します。
Can I view global air pollution on a map with IQAir AirVisual?
はい、IQAir AirVisualアプリは、2Dおよび3Dの世界の汚染マップを提供します。ユーザーは、パノラマビューとAirVisual Earth 3Dモデリングを通じて、世界中のリアルタイムの汚染指数を探索できます。
Does IQAir AirVisual offer health recommendations?
はい、IQAir AirVisualアプリは、健康リスクを低減し、汚染物質への曝露を最小限に抑えるための健康上の推奨事項を提供します。喘息などの呼吸器疾患を持つ敏感なグループに関する情報も含まれています。
Can I control my air purifier with the IQAir AirVisual app?
はい、IQAir AirVisualアプリを使用すると、Atem XおよびHealthProシリーズの空気清浄機をリモートで制御および監視できます。リアルタイムデータ、フィルターアラート、および室内空気質管理のためのスケジューリングを提供します。
Does the IQAir AirVisual app provide weather information?
はい、IQAir AirVisualアプリは包括的な天気情報を提供します。これには、気温、湿度、風、現在の状況、および予報の気象データが空気質の洞察とともに含まれます。
Can I track air quality in specific cities with IQAir AirVisual?
はい、IQAir AirVisualアプリを使用すると、世界中の特定の都市の空気質を追跡できます。100以上の場所について、リアルタイムのPM2.5濃度のライブに基づいて都市ランキングを提供します。
Does IQAir AirVisual integrate with external air quality monitors?
はい、IQAir AirVisualアプリは、IQAir AirVisual ProおよびAirVisual Outdoorモニターと同期します。この統合により、測定値、推奨事項が提供され、モニター設定の制御が可能になります。
以下のスクリーンショットと説明は、アプリの公式ストアリスティングから直接取得されたものであり、アプリ開発者の所有物です。
アプリストア
スクリーンショット
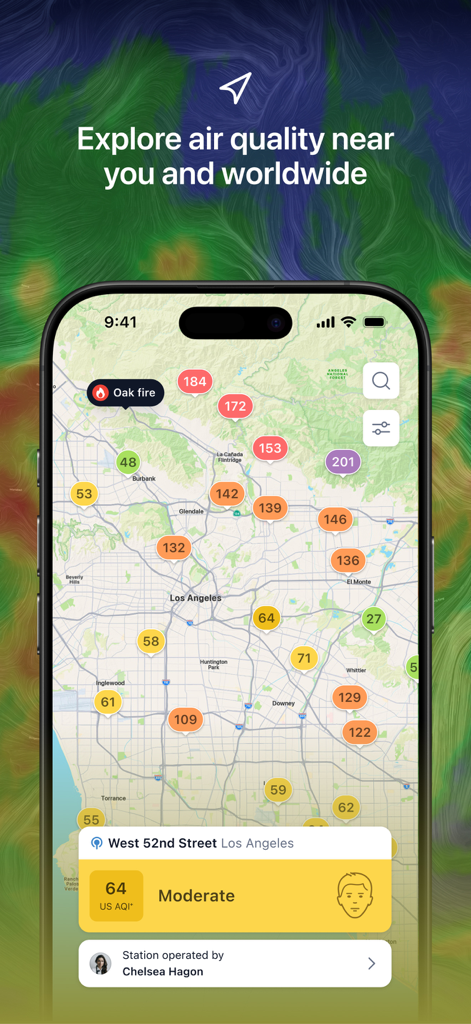
ロサンゼルスの汚染レベルと火災アラートを表示する、IQAir AirVisualアプリのリアルタイム空気質指数(AQI)マップ。
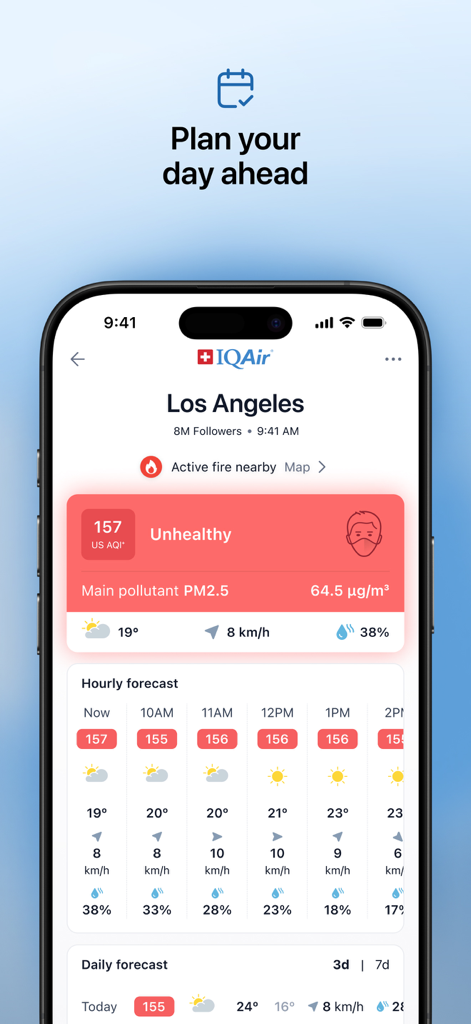
ロサンゼルスの空気質予測と不健康なAQIレベルを表示する、IQAir AirVisualアプリのインターフェース。
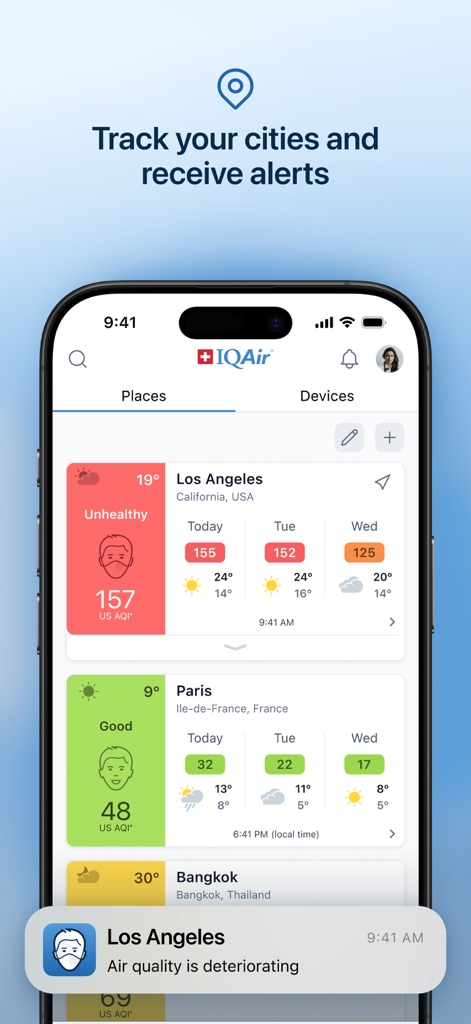
ロサンゼルスとパリの空気質レベルに加え、リアルタイムの悪化アラートを表示するIQAirアプリのインターフェースを備えたスマートフォン。
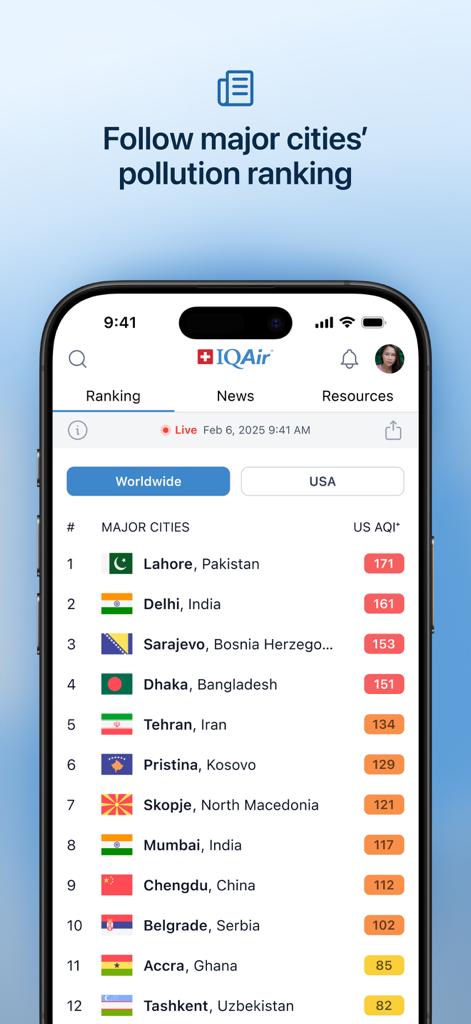
IQAirアプリ内の主要都市とそのリアルタイム空気質指数のランキングリスト。
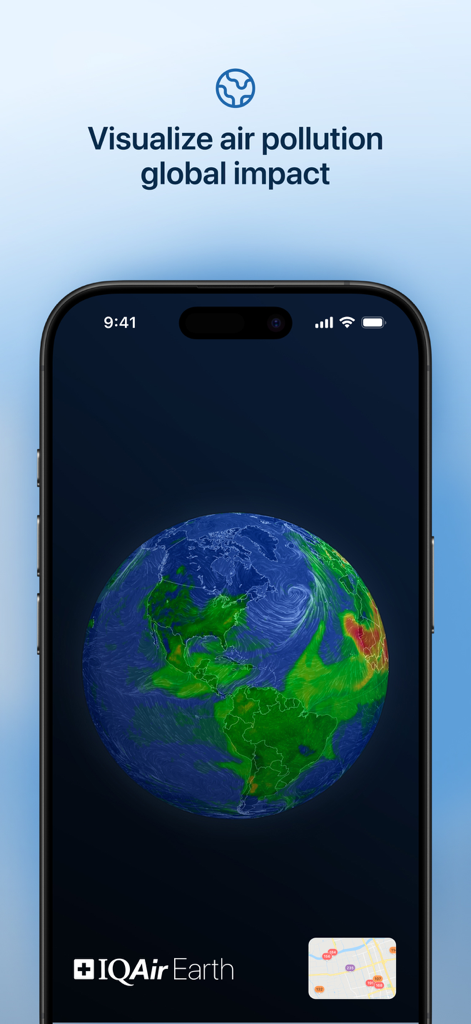
IQAir Earthで世界的な空気質の影響を表示する3D世界汚染マップ。
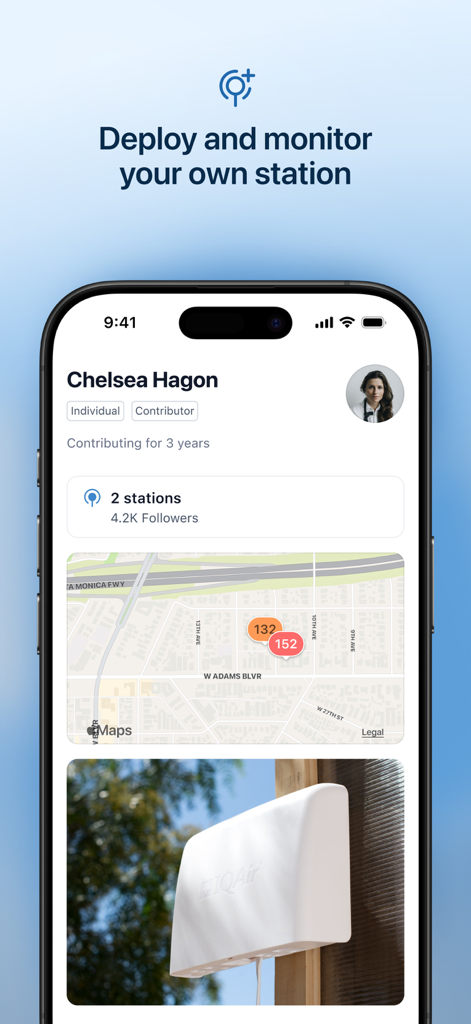
展開された2つの空気質監視ステーションとその地図上の位置をユーザープロファイルに表示するモバイルアプリ画面。
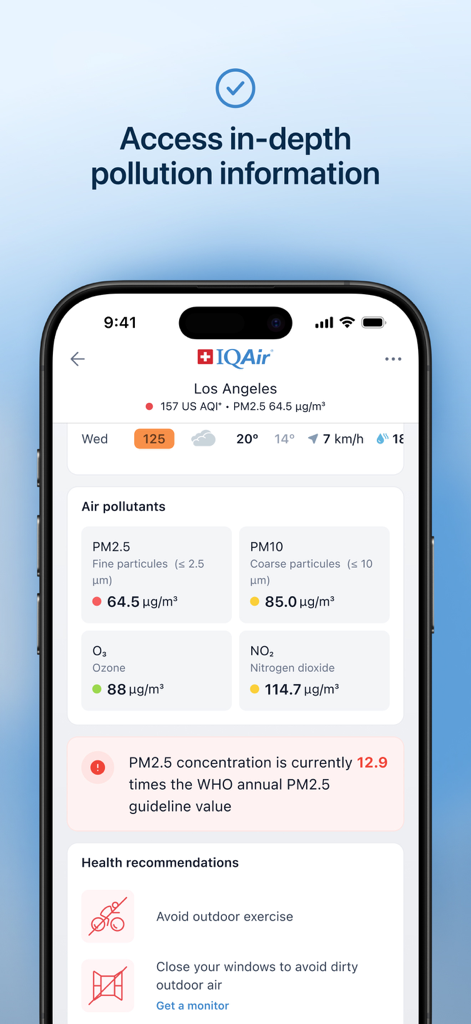
ロサンゼルスの空気質データと健康推奨事項を表示するIQAirアプリのインターフェース。
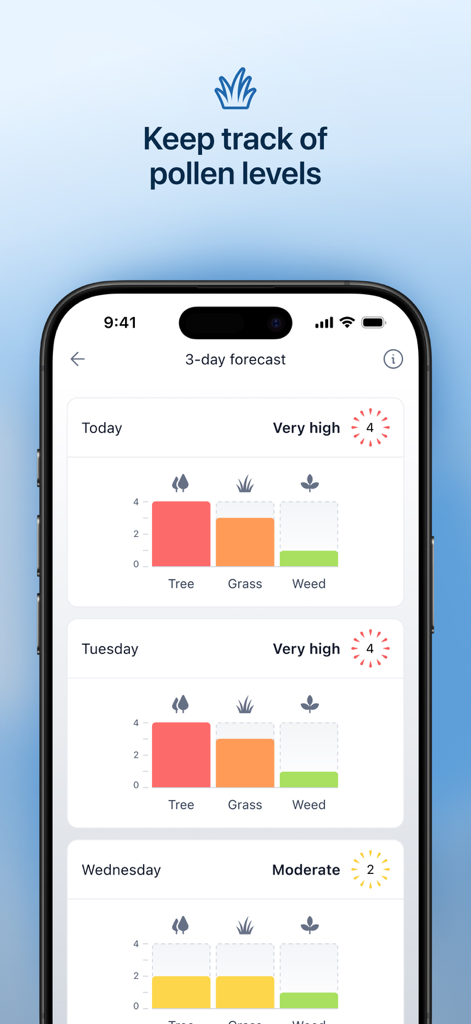
樹木、草、雑草のレベルを示す3日間の花粉予測を表示する、IQAir AirVisualアプリのスクリーンショット。
説明
Download
類似アプリ
似た機能とユーザー体験を持つアプリ

CalTopo: Backcountry Mapping
CalTopo LLC

My Altitude
Dayana Networks Ltd

Mountain-Forecast.com
Meteo365 Ltd.

My Tide Times - Tables & Chart
JRustonApps B.V.

UV Index Widget - Worldwide
Bjorn Jenssen

My Aurora Forecast Pro
JRustonApps B.V.

Aviation weather - METAR & TAF
Hermann Hoelter

RiverApp - River levels
Florian Bessiere

Dronecast: UAV & Drone Weather
Pinverse LTD
このページはアプリまたはその開発者の公式ページではなく、情報提供および論評を目的として作成された独立した編集出版物です。明示的に別段の記載がない限り、アプリおよびその開発者は、MWM、Apple、Google Play、アプリのパブリッシャー、またはアプリの開発者と提携、承認、後援、認可、またはその他の公式的な関係はなく、このページのいかなる内容も、アプリがMWMのサービスを使用して開発されたことを意味するものではありません。すべての商標、ロゴ、スクリーンショット、その他のコンテンツはそれぞれの所有者の財産です。