このページはアプリまたはその開発者の公式ページではなく、情報提供および論評を目的として作成された独立した編集出版物です。明示的に別段の記載がない限り、アプリおよびその開発者は、MWM、Apple、Google Play、アプリのパブリッシャー、またはアプリの開発者と提携、承認、後援、認可、またはその他の公式的な関係はなく、このページのいかなる内容も、アプリがMWMのサービスを使用して開発されたことを意味するものではありません。すべての商標、ロゴ、スクリーンショット、その他のコンテンツはそれぞれの所有者の財産です。

Merriman Market Analyst
天井と底を捉える技術をマスター。過去の太陽・月相加重値スコアを活用して、高い確率の転換ゾーンを特定し、機関投資家レベルの精度で取引タイミングを計りましょう。
ダウンロード
100ユーザー評価
評価数
0開発元
カテゴリ
Finance対応言語
1最新バージョン
1.0.9サイズ
14.1 MBリリース日
2024年5月23日周期的な精度で相場タイミングをマスター
過去の太陽・月相データと独自の加重値スコアを活用して、高い確率の転換ゾーンを事前に特定しましょう。
独自のWVスコア
数十年にわたる太陽・月相の相関研究に基づいた加重値で、転換確率を即座に評価します。
高精度な転換アラート
WVスコアが138を超え、3%の値動きの可能性が最も高くなった際の通知で、トレンドの先を行きましょう。
以下のスクリーンショットと説明は、アプリの公式ストアリスティングから直接取得されたものであり、アプリ開発者の所有物です。
アプリストア
スクリーンショット
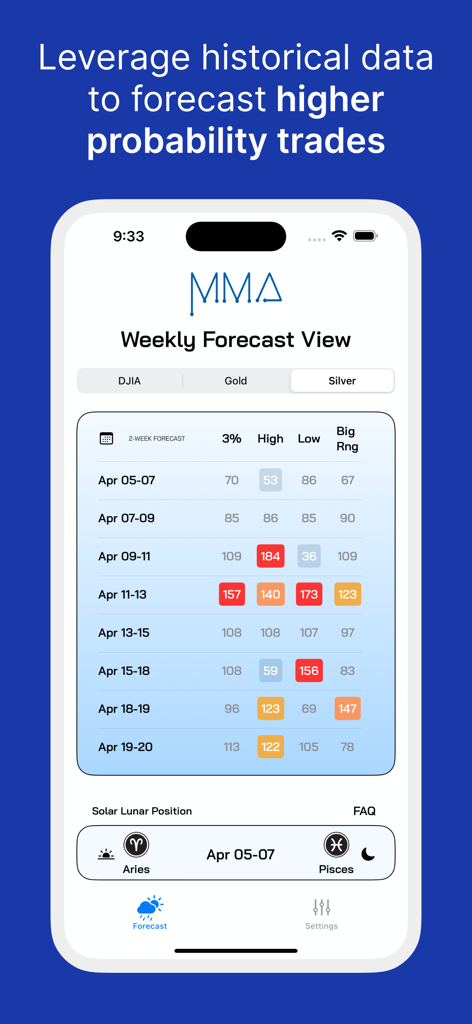
MMAアプリの週次予測画面。太陽と月の位置に基づいた銀の相場タイミングスコアを表示。
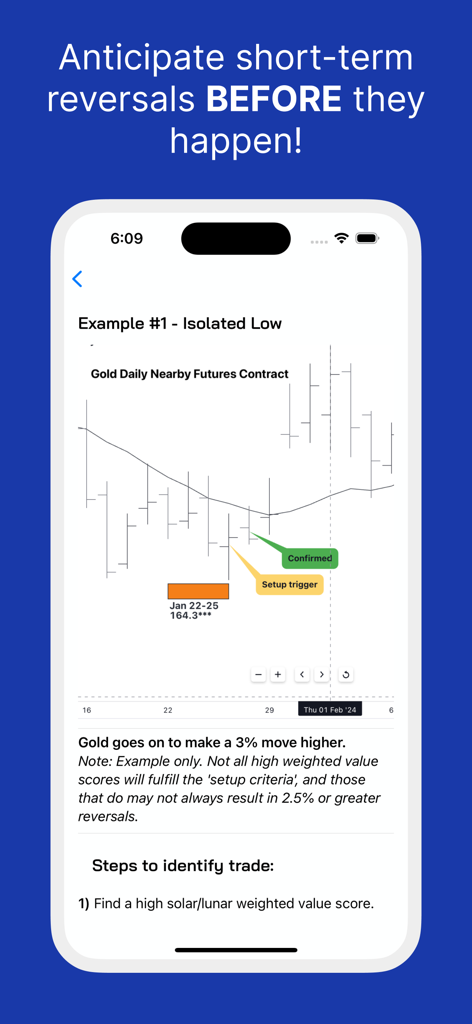
メリマン・マーケットアナリストアプリで、孤立した安値転換シグナルを示す金先物チャート。
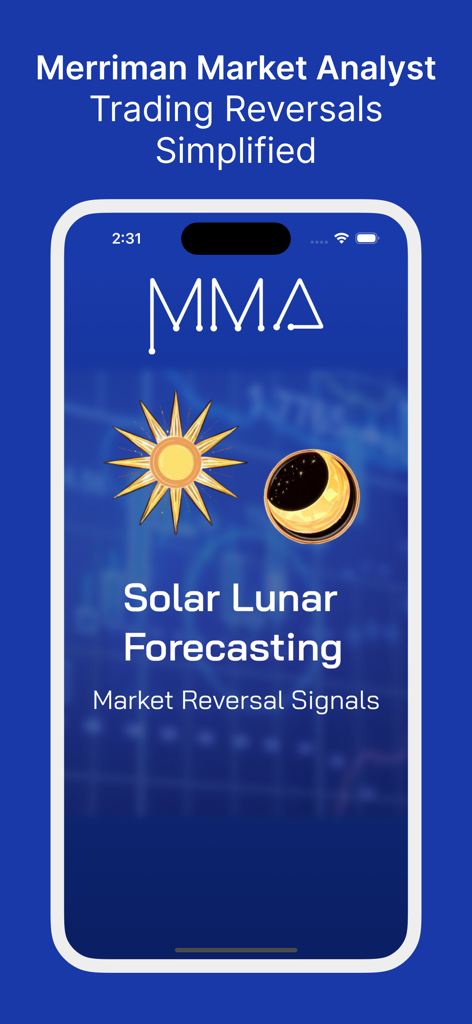
太陽・月相予測と相場転換シグナルを特徴とする、メリマン・マーケットアナリストアプリのスプラッシュスクリーン。
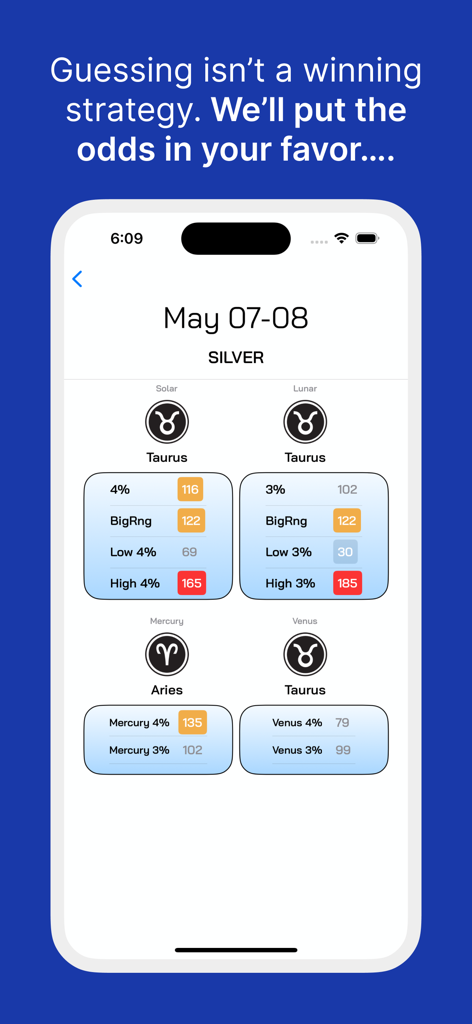
メリマン・マーケットアナリストアプリのインターフェース。太陽・月相周期に基づく銀取引のための加重値スコアを表示。
説明
Download
類似アプリ
同じカテゴリのトップランクアプリ

电子税务局
State Administration of Taxation

UnionPay APP
China Unionpay Co.,Ltd.

养基宝 - 年轻人的养基神器
Shenzhen Xiaoduotou Information Technology Co.,Ltd.

PayPal - Pay, Send, Save
PayPal, Inc.

中国农业银行
AGRICULTURAL BANK OF CHINA LIMITED

Mercado Pago: cuenta digital
MercadoLibre S.A.

Kalshi: Trade on the Big Game
KALSHI INC.

中国工商银行
Industrial and Commercial Bank of China

个人所得税
State Administration of Taxation
このページはアプリまたはその開発者の公式ページではなく、情報提供および論評を目的として作成された独立した編集出版物です。明示的に別段の記載がない限り、アプリおよびその開発者は、MWM、Apple、Google Play、アプリのパブリッシャー、またはアプリの開発者と提携、承認、後援、認可、またはその他の公式的な関係はなく、このページのいかなる内容も、アプリがMWMのサービスを使用して開発されたことを意味するものではありません。すべての商標、ロゴ、スクリーンショット、その他のコンテンツはそれぞれの所有者の財産です。