このページはアプリまたはその開発者の公式ページではなく、情報提供および論評を目的として作成された独立した編集出版物です。明示的に別段の記載がない限り、アプリおよびその開発者は、MWM、Apple、Google Play、アプリのパブリッシャー、またはアプリの開発者と提携、承認、後援、認可、またはその他の公式的な関係はなく、このページのいかなる内容も、アプリがMWMのサービスを使用して開発されたことを意味するものではありません。すべての商標、ロゴ、スクリーンショット、その他のコンテンツはそれぞれの所有者の財産です。

Ride Reporter (Turbulence)
主観的な印象を数値化されたモーション分析に変換します。リアルタイムの乱気流を追跡し、ジオタグ付きイベントを記録し、プロフェッショナルグレードの監視ツールで状況認識を高めます。
ダウンロード
300ユーザー評価
評価数
0開発元
カテゴリ
Reference対応言語
1最新バージョン
2.0サイズ
7.9 MBリリース日
2025年8月10日あらゆるフライトのための精密な指標
主観的な印象を超えましょう。プロフェッショナルグレードのGフォース監視と客観的な乱気流分析で、コックピットまたはキャビンの体験を変革します。
リアルタイムGフォース追跡
加速度の力を発生時に監視します。高頻度のセンサーアップデートで乱気流を数値化するための精密なモーションデータをキャプチャします。
ジオタグ付きイベントログ
乱気流が発生した正確な場所を自動的にマッピングします。フライトの場所ベースの履歴を構築して、繰り返される乱気流パターンを特定します。
以下のスクリーンショットと説明は、アプリの公式ストアリスティングから直接取得されたものであり、アプリ開発者の所有物です。
アプリストア
スクリーンショット
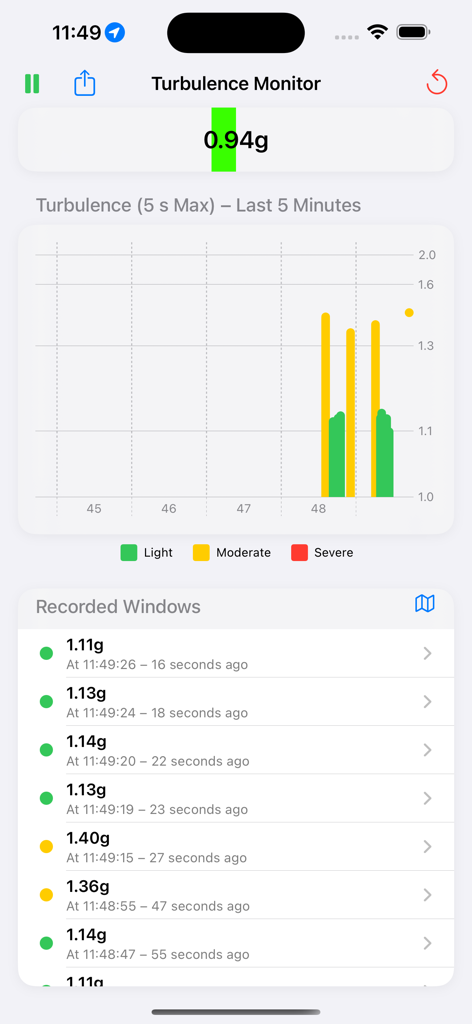
Ride Reporterアプリのインターフェース。ライブGフォースグラフと、強度レベルが表示された記録された乱気流イベントのリストが表示されています。
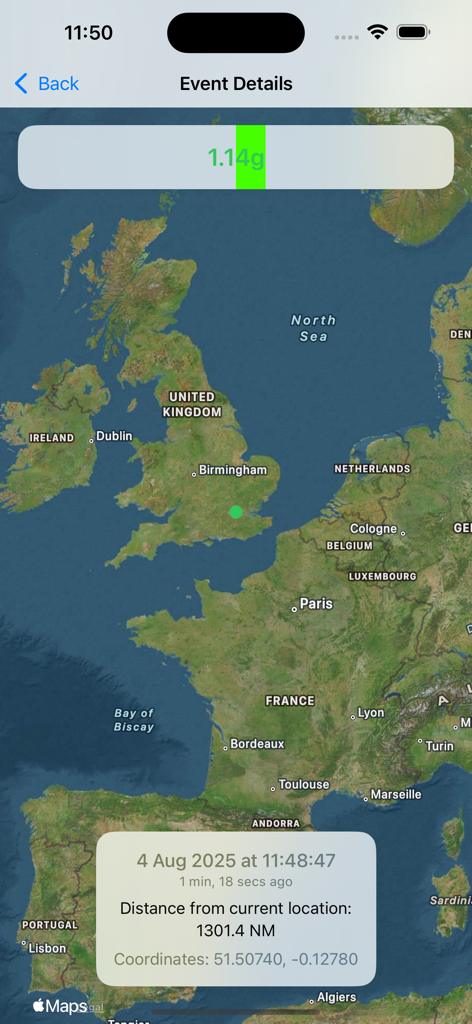
Ride Reporterアプリの画面。ヨーロッパの地図上に1.14gの乱気流イベントの詳細と場所が表示されています。
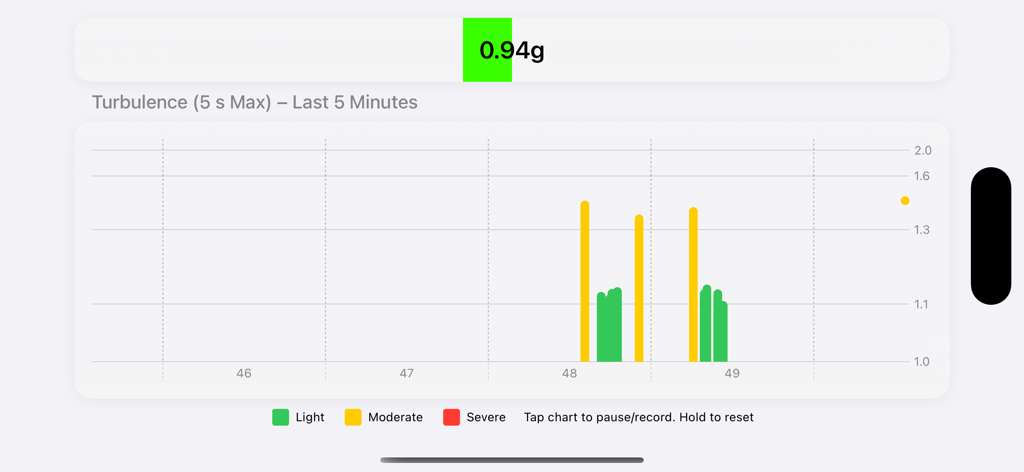
Ride ReporterアプリのリアルタイムGフォース追跡グラフ。5分間の軽度から中程度の乱気流レベルを示しています。
説明
Download
類似アプリ
同じカテゴリのトップランクアプリ

Google Translate
Google LLC

火箭沙盒
P2E CO., LTD.

Bible
Life.Church

Bible Chat: Daily Devotional
BookVitals APP SRL

Youdao Dictionary
Beijing NetEase Youdao Computer System Co.,Ltd

Translate Now - AI Translator
AIR APPS SYSTEMS, UNIPESSOAL, LDA

Naver Papago - AI Translator
NAVER Corp.

ΗiΤV - Endless Movies & Shows
学 张

Live Translator - AI Translate
DigitalSail (HK) Limited
このページはアプリまたはその開発者の公式ページではなく、情報提供および論評を目的として作成された独立した編集出版物です。明示的に別段の記載がない限り、アプリおよびその開発者は、MWM、Apple、Google Play、アプリのパブリッシャー、またはアプリの開発者と提携、承認、後援、認可、またはその他の公式的な関係はなく、このページのいかなる内容も、アプリがMWMのサービスを使用して開発されたことを意味するものではありません。すべての商標、ロゴ、スクリーンショット、その他のコンテンツはそれぞれの所有者の財産です。