このページはアプリまたはその開発者の公式ページではなく、情報提供および論評を目的として作成された独立した編集出版物です。明示的に別段の記載がない限り、アプリおよびその開発者は、MWM、Apple、Google Play、アプリのパブリッシャー、またはアプリの開発者と提携、承認、後援、認可、またはその他の公式的な関係はなく、このページのいかなる内容も、アプリがMWMのサービスを使用して開発されたことを意味するものではありません。すべての商標、ロゴ、スクリーンショット、その他のコンテンツはそれぞれの所有者の財産です。

Stock Screener Pro - Technical
チャートを一つずつ確認するのはもうやめましょう。MACD、RSI、ローソク足パターンなどの複数の指標を組み合わせて、米国市場全体を数秒でフィルタリング。夜のルーティンのために設計されたデータ駆動型のリサーチを。
ダウンロード
100K+ユーザー評価
評価数
0開発元
カテゴリ
Finance対応言語
1最新バージョン
1.6サイズ
8.6 MBリリース日
2015年12月2日精密なテクニカルスキャンで市場をマスター
規律あるスイングトレーダー向けにカスタマイズされた高度なテクニカル指標を通じて、数千の米国株をフィルタリングし、手作業のリサーチ時間を大幅に短縮します。
マルチインジケーター・パワースキャン
MACD、RSI、価格・出来高などの複数のテクニカル信号を1つのスキャンに統合し、高確率なトレードセットアップを数秒で見つけます。
夜のルーティンのために構築
忙しいプロフェッショナルに最適。リアルタイムの市場のノイズにさらされることなく、信頼性の高い終値データを使用して、仕事の後にトレードを計画できます。
以下のスクリーンショットと説明は、アプリの公式ストアリスティングから直接取得されたものであり、アプリ開発者の所有物です。
アプリストア
スクリーンショット
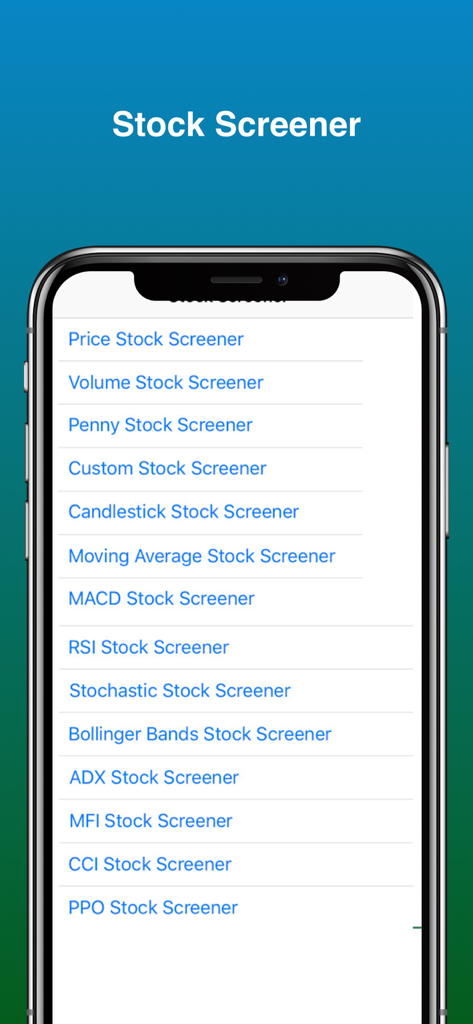
MACD、RSI、ボリンジャーバンドなどのテクニカル分析指標を表示するStock Screener Proのメインメニュー
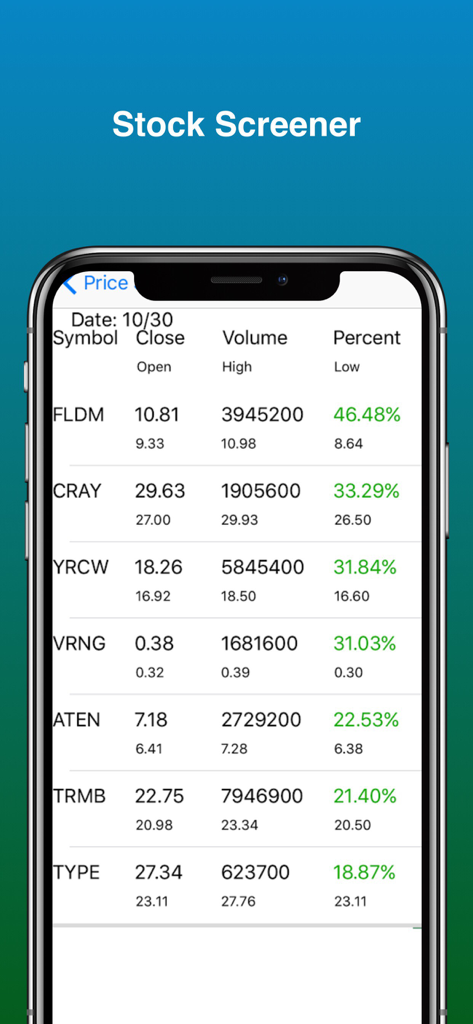
Stock Screener Proアプリでの価格と出来高データを含む値上がり率上位銘柄のリスト
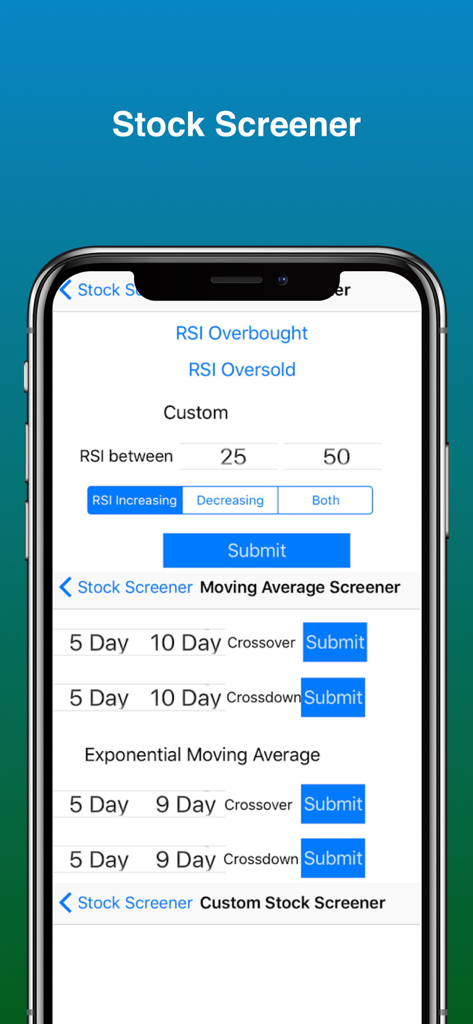
テクニカル分析ツールとRSIフィルター設定を表示するStock Screener Proアプリのインターフェース
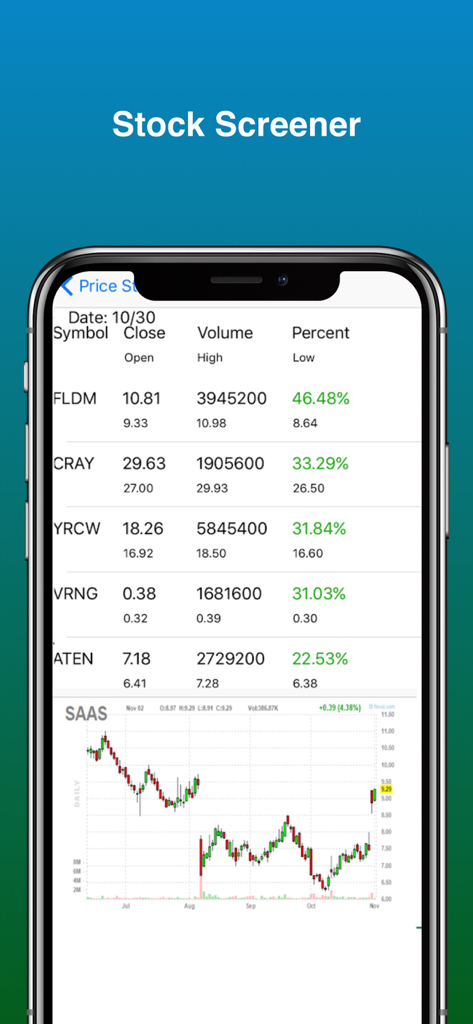
銘柄リストとテクニカルローソク足チャートを表示するStock Screener Proアプリ
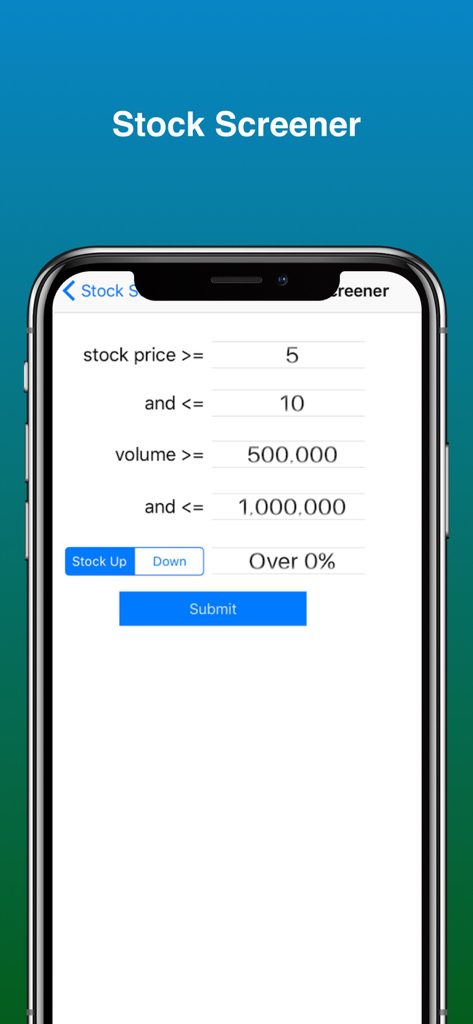
Stock Screener Proで株価と出来高のフィルターを設定するためのインターフェース
説明
Download
類似アプリ
同じカテゴリのトップランクアプリ

电子税务局
State Administration of Taxation

UnionPay APP
China Unionpay Co.,Ltd.

养基宝 - 年轻人的养基神器
Shenzhen Xiaoduotou Information Technology Co.,Ltd.

PayPal - Pay, Send, Save
PayPal, Inc.

中国农业银行
AGRICULTURAL BANK OF CHINA LIMITED

Mercado Pago: cuenta digital
MercadoLibre S.A.

Kalshi: Trade on the Big Game
KALSHI INC.

中国工商银行
Industrial and Commercial Bank of China

个人所得税
State Administration of Taxation
このページはアプリまたはその開発者の公式ページではなく、情報提供および論評を目的として作成された独立した編集出版物です。明示的に別段の記載がない限り、アプリおよびその開発者は、MWM、Apple、Google Play、アプリのパブリッシャー、またはアプリの開発者と提携、承認、後援、認可、またはその他の公式的な関係はなく、このページのいかなる内容も、アプリがMWMのサービスを使用して開発されたことを意味するものではありません。すべての商標、ロゴ、スクリーンショット、その他のコンテンツはそれぞれの所有者の財産です。