이 페이지는 앱이나 개발자의 공식 페이지가 아니며, 정보 제공 및 논평을 목적으로 작성된 독립 편집 간행물입니다. 명시적으로 달리 언급되지 않는 한, 해당 앱이나 개발자는 MWM, Apple, Google Play, 앱 퍼블리셔 또는 앱 개발자와 제휴, 보증, 후원, 승인 또는 공식적으로 연결되어 있지 않으며, 이 페이지의 어떤 내용도 해당 앱이 MWM의 서비스를 사용하여 개발되었음을 의미하지 않습니다. 모든 상표, 로고, 스크린샷 및 기타 콘텐츠는 해당 소유자의 자산입니다.

Easy Dashboard for Indicators
수동 차트 스캔에 시간을 낭비하지 마세요. 전문가 수준의 시장 조망을 확보하고 사용자 정의 가능한 알림을 받아 이동 중에도 거래 기회를 놓치지 마세요.
다운로드
20K+사용자 평점
총 평가 수
1K+개발사
카테고리
Finance지원 언어
1최신 버전
5.4.1크기
96.5 MB출시일
2017년 9월 7일전문가 수준의 명확성으로 시장을 마스터하세요
어수선한 차트와의 씨름을 멈추세요. 당사의 지능형 대시보드는 복잡한 시장 데이터를 실행 가능한 통찰력으로 요약하여 어디서든 자신 있게 거래할 수 있도록 합니다.
올인원 대시보드
단일 화면에서 여러 기술 지표와 통화 쌍을 모니터링하여 분석 마비를 제거하고 추세를 한눈에 파악하세요.
스마트 Alerts+
이동 중에 고확률 설정을 놓치지 않도록 특정 전략 매개변수를 기반으로 완벽하게 사용자 정의 가능한 알림을 설정하세요.
다음 스크린샷과 설명은 앱의 공식 스토어 목록에서 직접 가져온 것이며 앱 개발자의 자산입니다.
앱 스토어
스크린샷
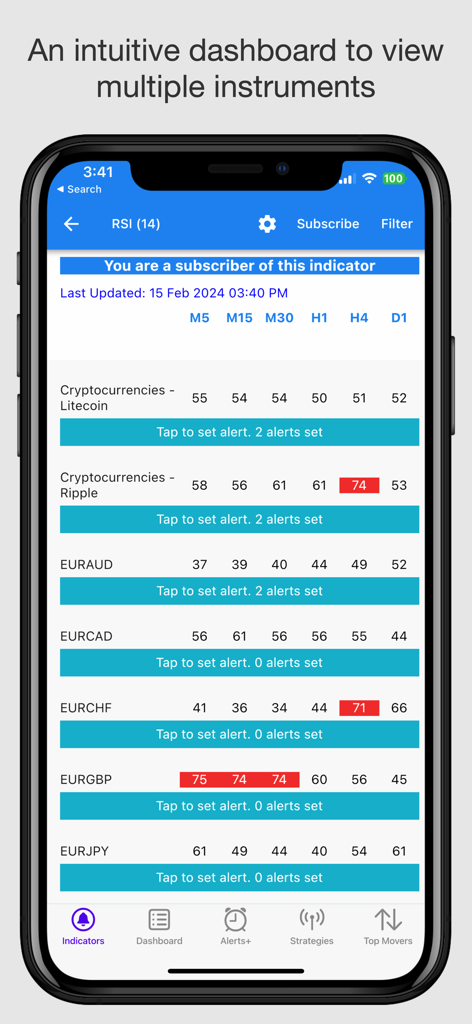
다양한 시간대에 걸쳐 여러 금융 상품에 대한 RSI 기술 지표 값을 보여주는 간편한 대시보드 앱 인터페이스
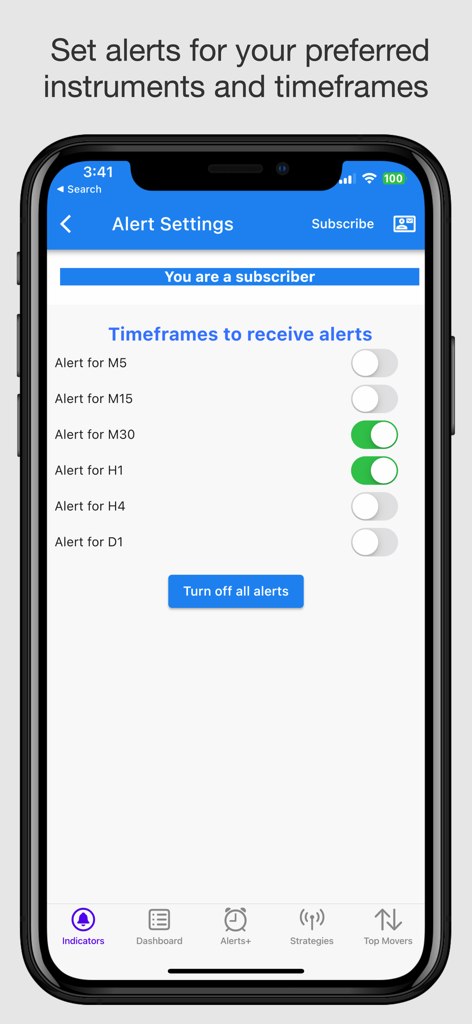
여러 시간대에 걸친 기술 지표 알림을 사용자 정의하기 위한 알림 설정 화면.
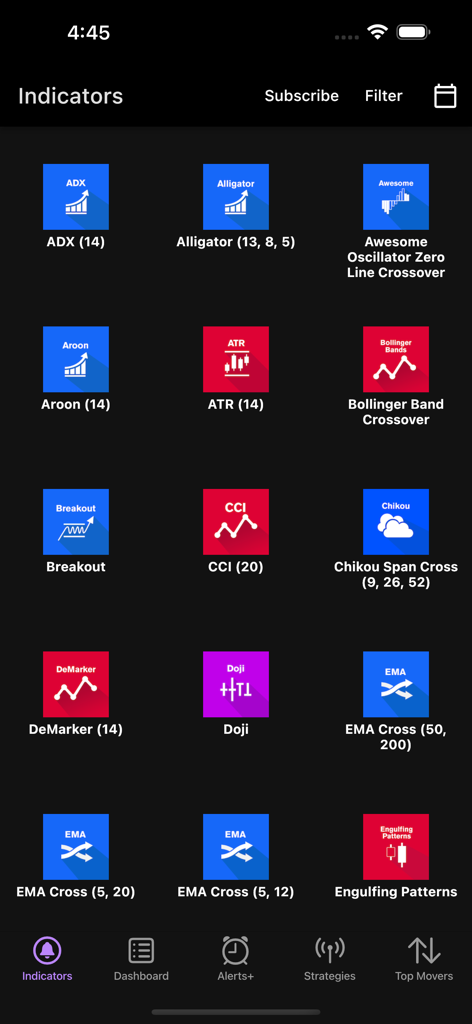
ADX, Alligator, Bollinger Bands 크로스오버를 포함한 기술 거래 지표 목록을 표시하는 모바일 화면
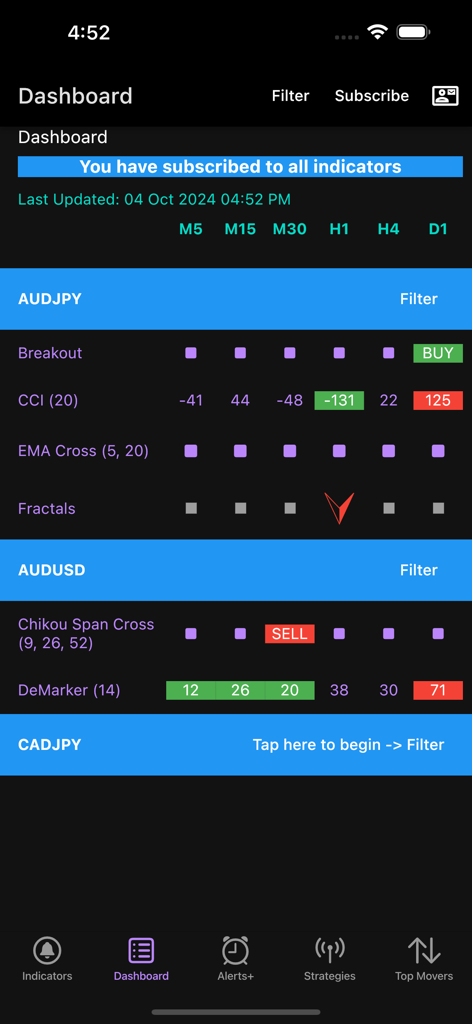
통화 거래를 위한 실시간 기술 지표를 보여주는 모바일 대시보드
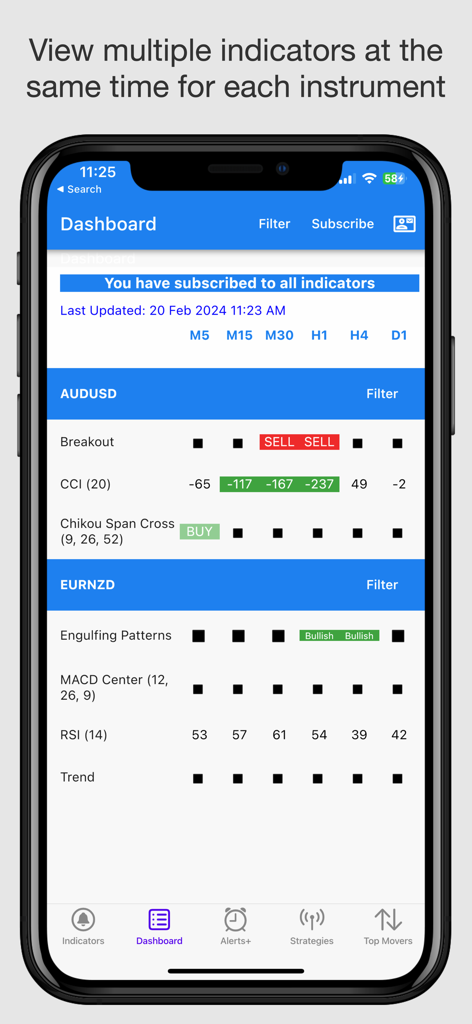
AUDUSD 및 EURNZD와 같은 통화 쌍에 대한 여러 기술 거래 지표를 표시하는 모바일 대시보드
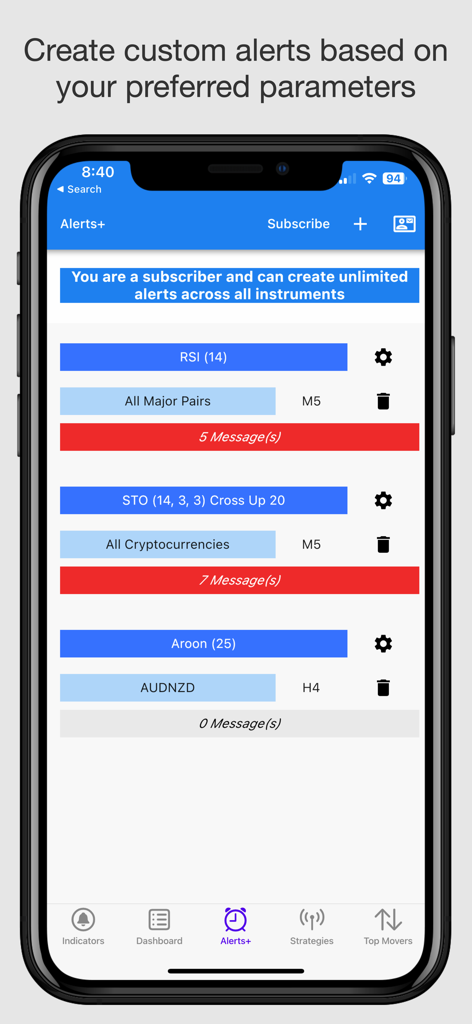
사용자 정의 거래 지표 알림을 위한 Alerts plus 기능을 보여주는 모바일 앱 인터페이스.
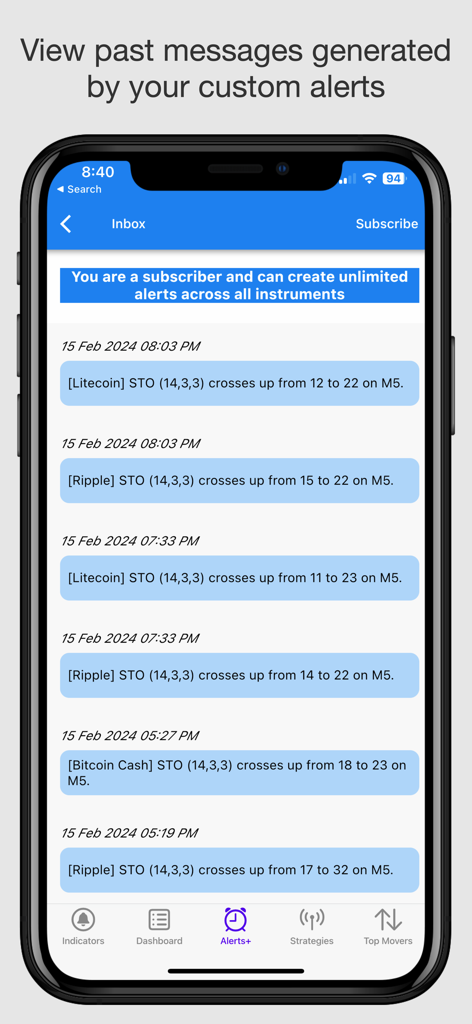
암호화폐 지표에 대한 과거 거래 알림 목록을 보여주는 모바일 앱 화면
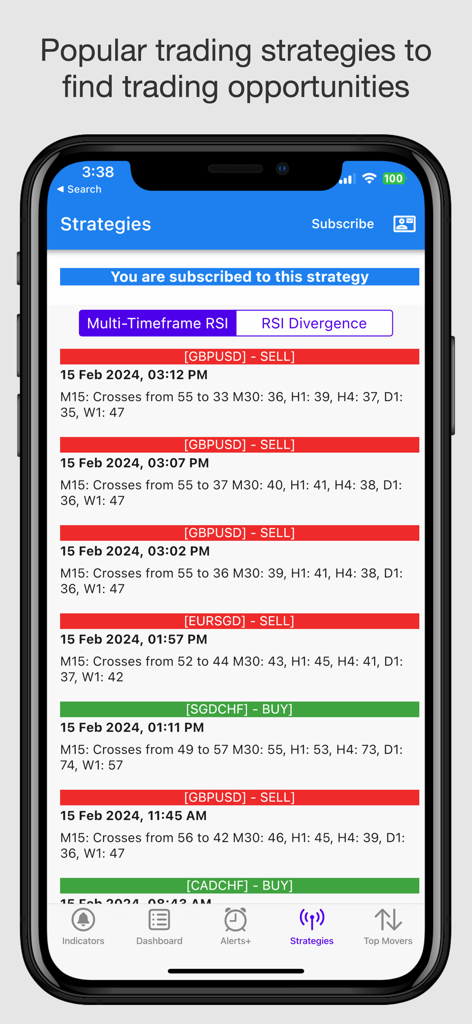
인기 있는 거래 전략을 기반으로 다양한 통화 쌍에 대한 매수 및 매도 신호를 표시하는 간편한 대시보드 모바일 앱 화면
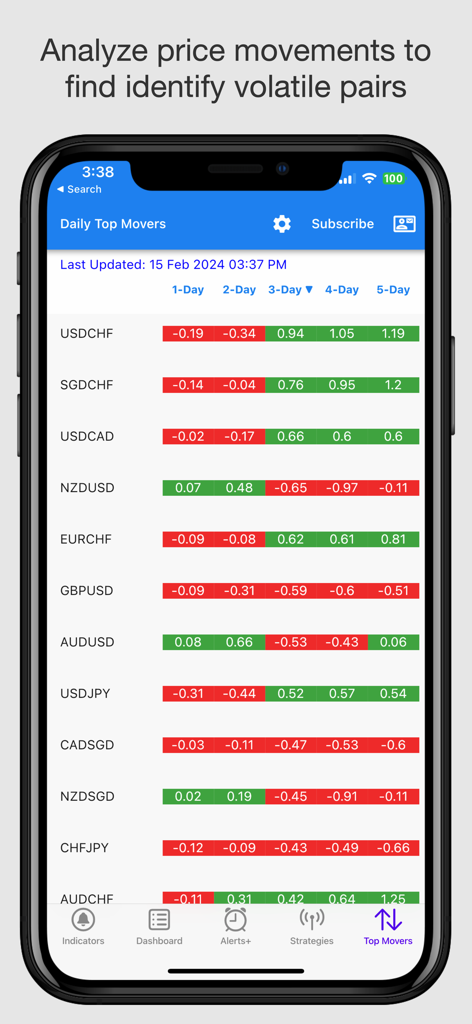
다일 가격 변동률과 함께 외환 통화 쌍의 일일 상위 이동 종목을 표시하는 모바일 앱 인터페이스
설명
Download
비슷한 앱
유사한 기능과 사용자 경험을 가진 앱

Into the Cryptoverse
BC Analytics, LLC

Questrade Edge Mobile
Questrade Inc.

Realtime Stock Screener
Maxim Golokhov

Flow Greeks : Unusual Options
Flow Greeks LLC

Unusual Whales
Unusual Whales Inc

Super Stocks with Options
Mobile Interactive LLC

Ave Pro
AVE AI DATA AU TECHNOLOGY PTY LTD

Option Signal Alert
KYOTO K.K.

OptionsFlow
Asian Digital Mind Limited
이 페이지는 앱이나 개발자의 공식 페이지가 아니며, 정보 제공 및 논평을 목적으로 작성된 독립 편집 간행물입니다. 명시적으로 달리 언급되지 않는 한, 해당 앱이나 개발자는 MWM, Apple, Google Play, 앱 퍼블리셔 또는 앱 개발자와 제휴, 보증, 후원, 승인 또는 공식적으로 연결되어 있지 않으며, 이 페이지의 어떤 내용도 해당 앱이 MWM의 서비스를 사용하여 개발되었음을 의미하지 않습니다. 모든 상표, 로고, 스크린샷 및 기타 콘텐츠는 해당 소유자의 자산입니다.