이 페이지는 앱이나 개발자의 공식 페이지가 아니며, 정보 제공 및 논평을 목적으로 작성된 독립 편집 간행물입니다. 명시적으로 달리 언급되지 않는 한, 해당 앱이나 개발자는 MWM, Apple, Google Play, 앱 퍼블리셔 또는 앱 개발자와 제휴, 보증, 후원, 승인 또는 공식적으로 연결되어 있지 않으며, 이 페이지의 어떤 내용도 해당 앱이 MWM의 서비스를 사용하여 개발되었음을 의미하지 않습니다. 모든 상표, 로고, 스크린샷 및 기타 콘텐츠는 해당 소유자의 자산입니다.

Merriman Market Analyst
고점과 저점을 선택하는 기술을 마스터하세요. 과거 태양/태음력 가중치 점수를 활용하여 높은 확률의 반전 구역을 식별하고 기관 수준의 정밀도로 거래를 타이밍하세요.
다운로드
100사용자 평점
총 평가 수
0개발사
카테고리
Finance지원 언어
1최신 버전
1.0.9크기
14.1 MB출시일
2024년 5월 23일주기적 정밀도로 시장 타이밍 마스터하기
과거 태양/태음력 데이터와 독점적인 가중치 점수를 활용하여 높은 확률의 반전 구역이 발생하기 전에 식별합니다.
독점 WV 점수
수십 년간의 태양/달 상관 관계 연구를 기반으로 한 가중치를 사용하여 반전 확률을 즉시 평가합니다.
정밀 반전 알림
WV 점수가 138을 초과하여 3% 시장 움직임의 가능성이 가장 높음을 신호할 때 추세보다 앞서 나가세요.
다음 스크린샷과 설명은 앱의 공식 스토어 목록에서 직접 가져온 것이며 앱 개발자의 자산입니다.
앱 스토어
스크린샷
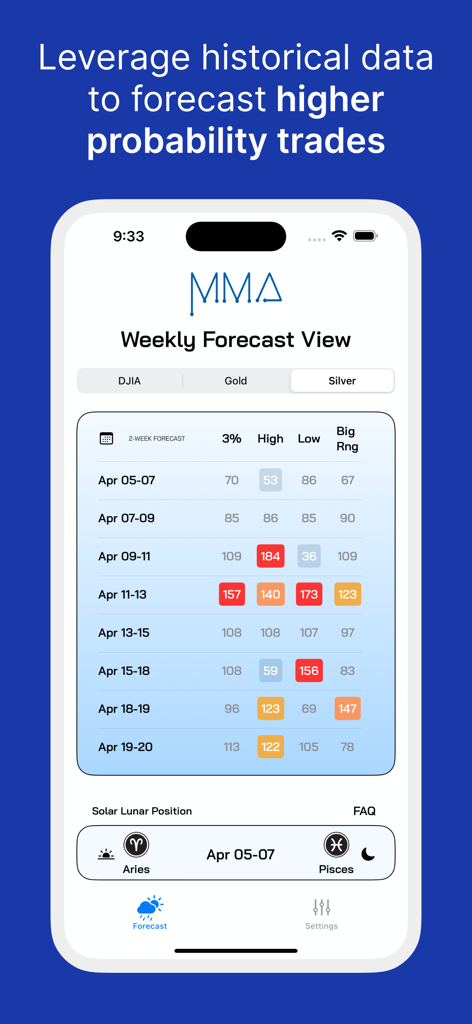
MMA 앱의 주간 예측 보기. 태양 및 달 위치에 기반한 은의 시장 타이밍 점수를 보여줍니다.
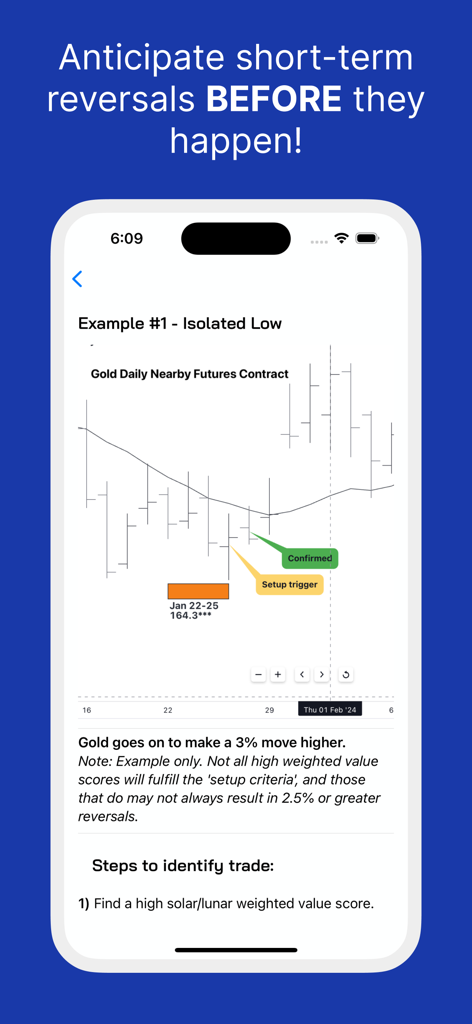
Merriman Market Analyst 앱에서 고립된 저점 반전 신호를 보여주는 금 선물 차트
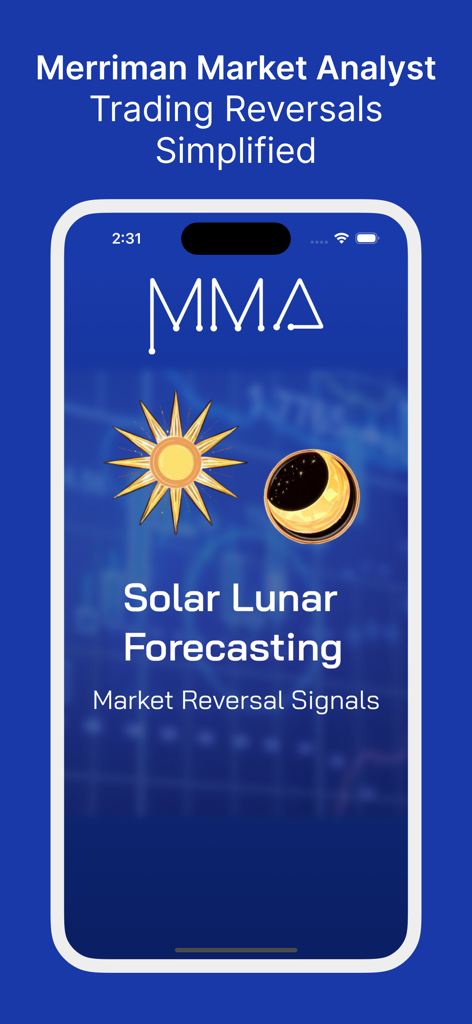
태양력 및 태음력 예측 및 시장 반전 신호를 특징으로 하는 Merriman Market Analyst 앱 스플래시 화면
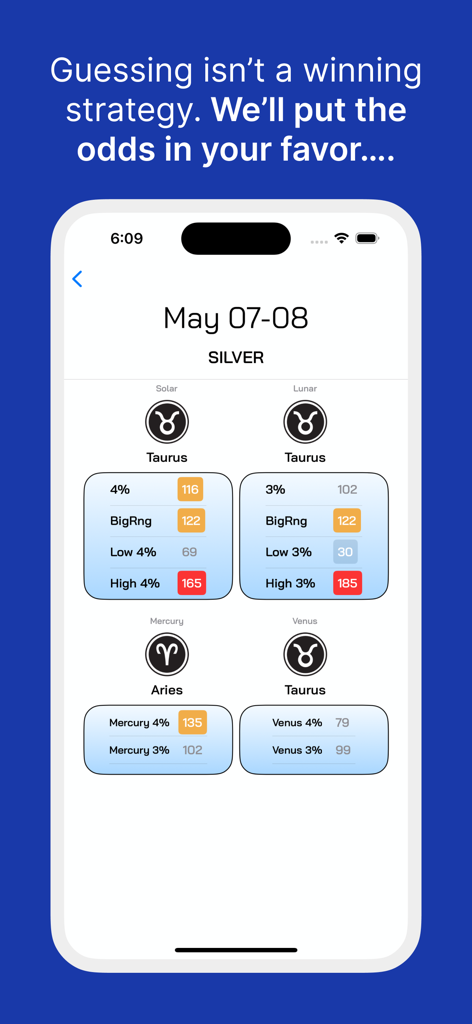
Merriman Market Analyst 앱 인터페이스는 태양 및 태음력 주기에 기반한 은 거래에 대한 가중치 점수를 표시합니다.
설명
Download
비슷한 앱
같은 카테고리의 상위 앱

电子税务局
State Administration of Taxation

UnionPay APP
China Unionpay Co.,Ltd.

养基宝 - 年轻人的养基神器
Shenzhen Xiaoduotou Information Technology Co.,Ltd.

PayPal - Pay, Send, Save
PayPal, Inc.

中国农业银行
AGRICULTURAL BANK OF CHINA LIMITED

Mercado Pago: cuenta digital
MercadoLibre S.A.

Kalshi: Trade on the Big Game
KALSHI INC.

中国工商银行
Industrial and Commercial Bank of China

个人所得税
State Administration of Taxation
이 페이지는 앱이나 개발자의 공식 페이지가 아니며, 정보 제공 및 논평을 목적으로 작성된 독립 편집 간행물입니다. 명시적으로 달리 언급되지 않는 한, 해당 앱이나 개발자는 MWM, Apple, Google Play, 앱 퍼블리셔 또는 앱 개발자와 제휴, 보증, 후원, 승인 또는 공식적으로 연결되어 있지 않으며, 이 페이지의 어떤 내용도 해당 앱이 MWM의 서비스를 사용하여 개발되었음을 의미하지 않습니다. 모든 상표, 로고, 스크린샷 및 기타 콘텐츠는 해당 소유자의 자산입니다.