이 페이지는 앱이나 개발자의 공식 페이지가 아니며, 정보 제공 및 논평을 목적으로 작성된 독립 편집 간행물입니다. 명시적으로 달리 언급되지 않는 한, 해당 앱이나 개발자는 MWM, Apple, Google Play, 앱 퍼블리셔 또는 앱 개발자와 제휴, 보증, 후원, 승인 또는 공식적으로 연결되어 있지 않으며, 이 페이지의 어떤 내용도 해당 앱이 MWM의 서비스를 사용하여 개발되었음을 의미하지 않습니다. 모든 상표, 로고, 스크린샷 및 기타 콘텐츠는 해당 소유자의 자산입니다.

Stock Screener Pro - Technical
차트를 하나씩 확인하지 마세요. MACD, RSI, 캔들스틱 패턴과 같은 여러 지표를 결합하여 미국 시장 전체를 단 몇 초 만에 필터링하세요. 귀하의 저녁 루틴을 위해 설계된 데이터 기반 리서치입니다.
다운로드
100K+사용자 평점
총 평가 수
0개발사
카테고리
Finance지원 언어
1최신 버전
1.6크기
8.6 MB출시일
2015년 12월 2일정밀 기술적 스캐닝으로 시장을 장악하세요
절제된 스윙 트레이더를 위해 맞춤 설계된 고급 기술 지표를 통해 수천 개의 미국 주식을 필터링하여 수동 리서치 시간을 절약하세요.
멀티 지표 파워 스캐닝
MACD, RSI, 가격 거래량과 같은 여러 기술적 신호를 단일 스캔으로 결합하여 고확률 매매 셋업을 수 초 만에 찾아보세요.
당신의 저녁 루틴을 위한 설계
바쁜 직장인에게 완벽합니다. 신뢰할 수 있는 일일 종가(EOD) 데이터를 사용하여 실시간 시장 노이즈의 압박 없이 퇴근 후 매매 계획을 세우세요.
다음 스크린샷과 설명은 앱의 공식 스토어 목록에서 직접 가져온 것이며 앱 개발자의 자산입니다.
앱 스토어
스크린샷
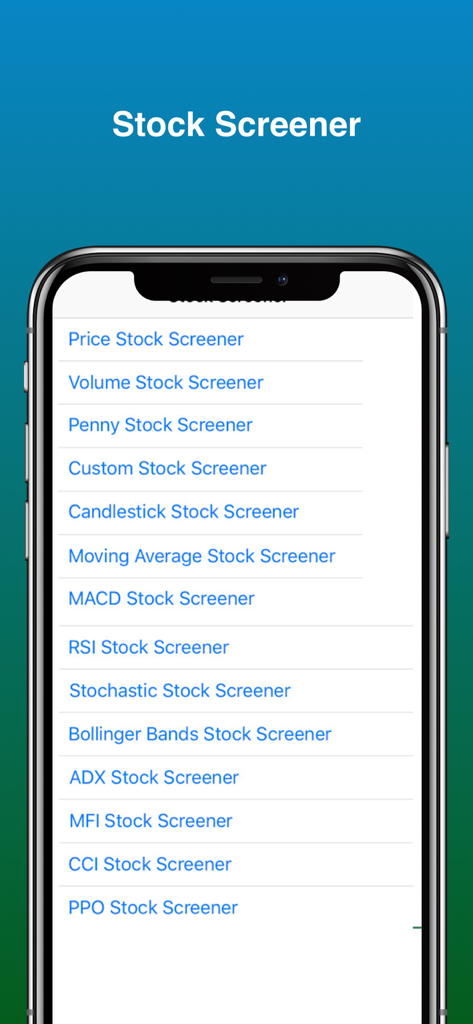
MACD, RSI, 볼린저 밴드와 같은 기술적 분석 지표를 보여주는 Stock Screener Pro의 메인 메뉴
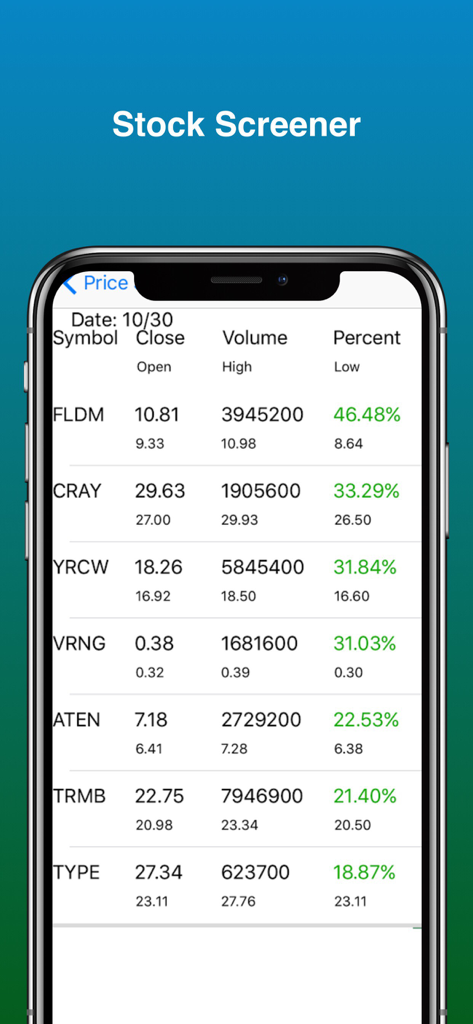
Stock Screener Pro 앱에서 가격 및 거래량 데이터가 포함된 주가 상승률 상위 종목 리스트
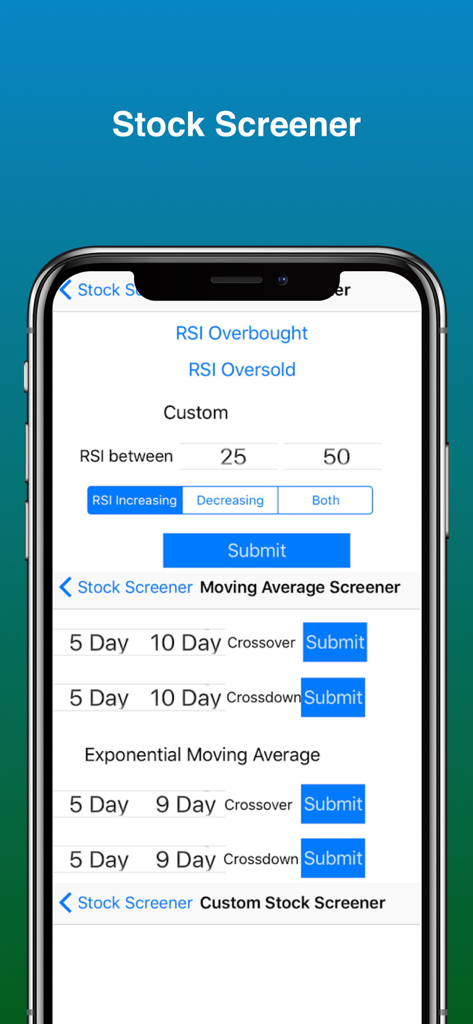
기술적 분석 도구 및 RSI 필터 설정이 표시된 Stock Screener Pro 앱의 인터페이스
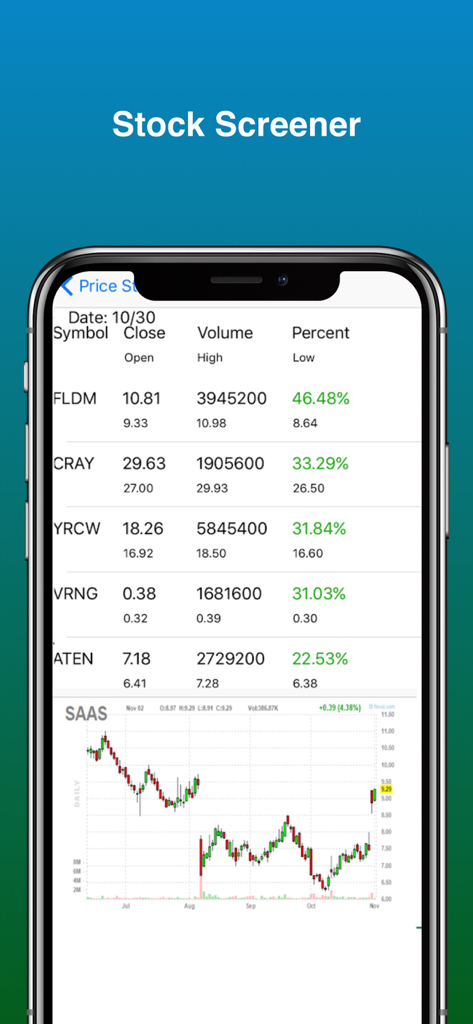
주식 리스트와 기술적 캔들스틱 차트를 보여주는 Stock Screener Pro 앱
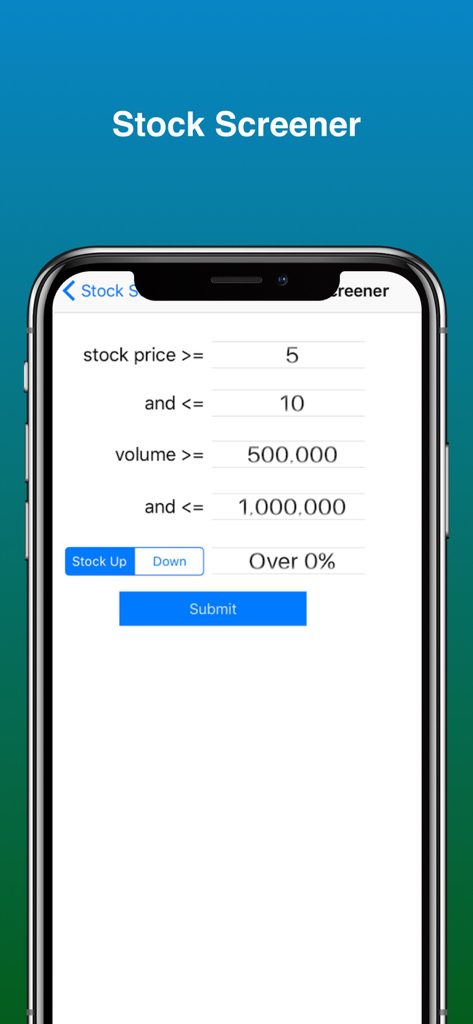
Stock Screener Pro에서 주가 및 거래량 필터를 설정하는 인터페이스
설명
Download
비슷한 앱
같은 카테고리의 상위 앱

电子税务局
State Administration of Taxation

UnionPay APP
China Unionpay Co.,Ltd.

养基宝 - 年轻人的养基神器
Shenzhen Xiaoduotou Information Technology Co.,Ltd.

PayPal - Pay, Send, Save
PayPal, Inc.

中国农业银行
AGRICULTURAL BANK OF CHINA LIMITED

Mercado Pago: cuenta digital
MercadoLibre S.A.

Kalshi: Trade on the Big Game
KALSHI INC.

中国工商银行
Industrial and Commercial Bank of China

个人所得税
State Administration of Taxation
이 페이지는 앱이나 개발자의 공식 페이지가 아니며, 정보 제공 및 논평을 목적으로 작성된 독립 편집 간행물입니다. 명시적으로 달리 언급되지 않는 한, 해당 앱이나 개발자는 MWM, Apple, Google Play, 앱 퍼블리셔 또는 앱 개발자와 제휴, 보증, 후원, 승인 또는 공식적으로 연결되어 있지 않으며, 이 페이지의 어떤 내용도 해당 앱이 MWM의 서비스를 사용하여 개발되었음을 의미하지 않습니다. 모든 상표, 로고, 스크린샷 및 기타 콘텐츠는 해당 소유자의 자산입니다.