이 페이지는 앱이나 개발자의 공식 페이지가 아니며, 정보 제공 및 논평을 목적으로 작성된 독립 편집 간행물입니다. 명시적으로 달리 언급되지 않는 한, 해당 앱이나 개발자는 MWM, Apple, Google Play, 앱 퍼블리셔 또는 앱 개발자와 제휴, 보증, 후원, 승인 또는 공식적으로 연결되어 있지 않으며, 이 페이지의 어떤 내용도 해당 앱이 MWM의 서비스를 사용하여 개발되었음을 의미하지 않습니다. 모든 상표, 로고, 스크린샷 및 기타 콘텐츠는 해당 소유자의 자산입니다.
Stock+: Stock Market Heat Map
끝없이 스크롤하는 티커는 이제 그만. 대화형 트림맵, 전문 기술 지표, 데이터 중심 투자자를 위한 심층 섹터 분석으로 시장 선두 주자를 즉시 파악하세요.
주요 수치
다운로드
2K+
사용자 평점
4.4/5
총 평가 수
100
개발사
Kemal Bakacak
카테고리
Finance
지원 언어
3
최신 버전
3.10.0
크기
21.2 MB
출시일
2024년 1월 15일
기능
시장을 한눈에 파악하여 마스터하세요
끝없이 스크롤하는 티커 목록은 이제 그만. 대화형 히트맵과 전문 기술 지표를 사용하여 몇 초 만에 동향을 시각화하고 정보에 입각한 결정을 내리세요.
대화형 시장 히트맵
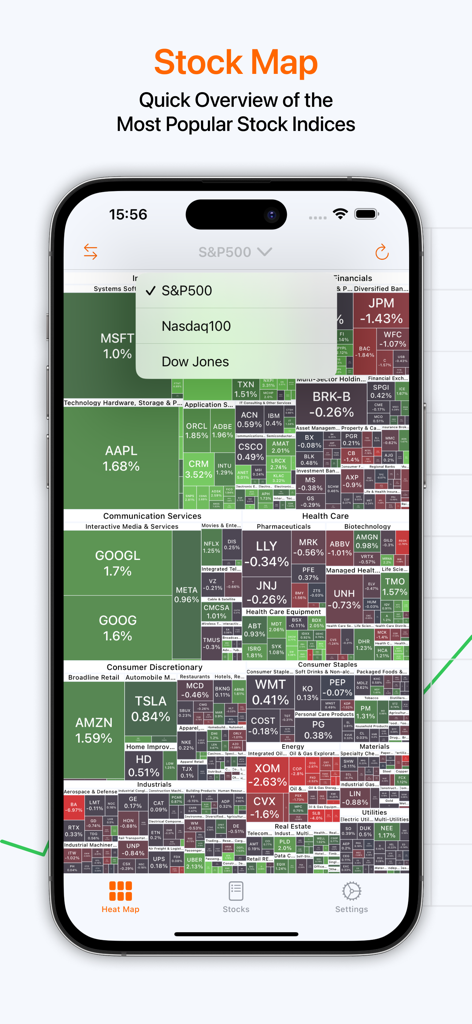
시장 심리를 즉시 파악하세요. 시가총액 기준으로 크기 조정된 색상 코드 트림맵을 통해 S&P 500, Nasdaq 및 Dow Jones를 시각화하세요.
섹터 로테이션 인사이트
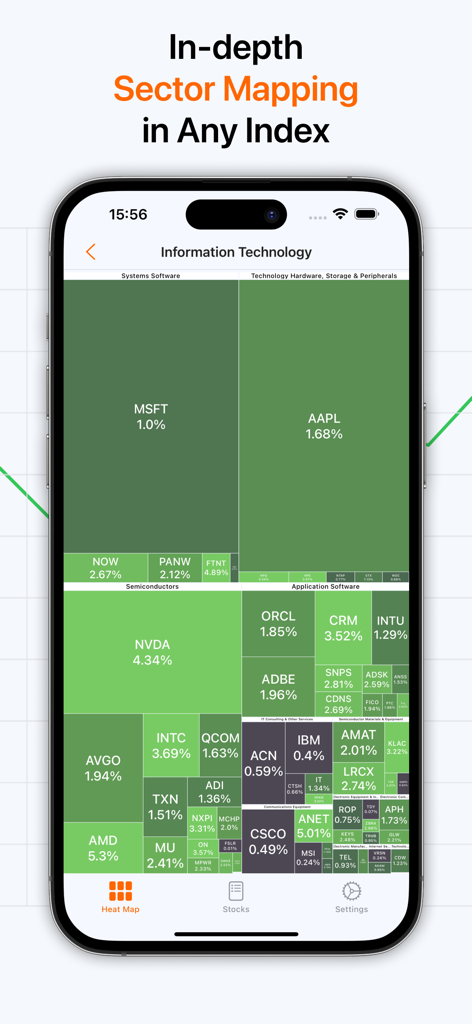
특정 섹터 및 산업을 심층 분석하여 선두 주자와 후발 주자를 파악하세요. 실시간으로 자금이 어디로 흐르는지 이해하세요.
다음 스크린샷과 설명은 앱의 공식 스토어 목록에서 직접 가져온 것이며 앱 개발자의 자산입니다.
앱 스토어
스크린샷
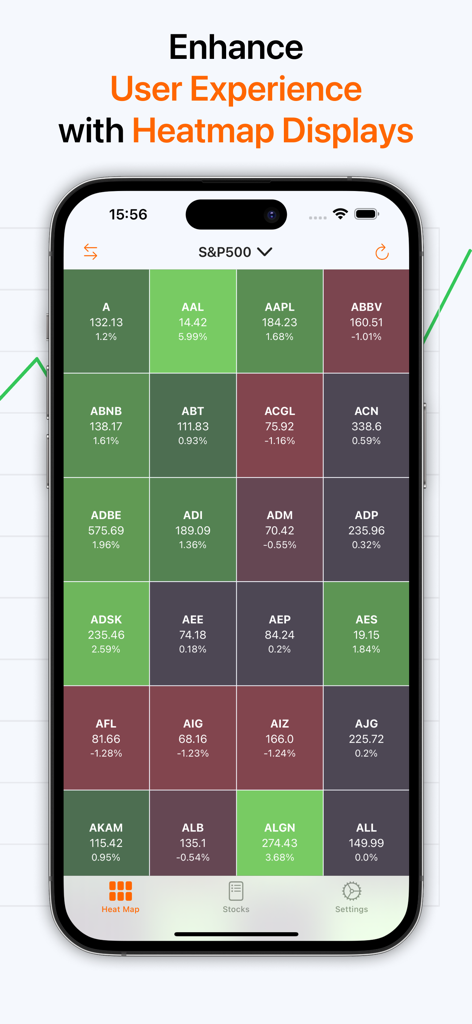
주식 섹터별 성과를 보여주는 S&P 500 지수의 인터랙티브 히트맵을 보여주는 모바일 앱.
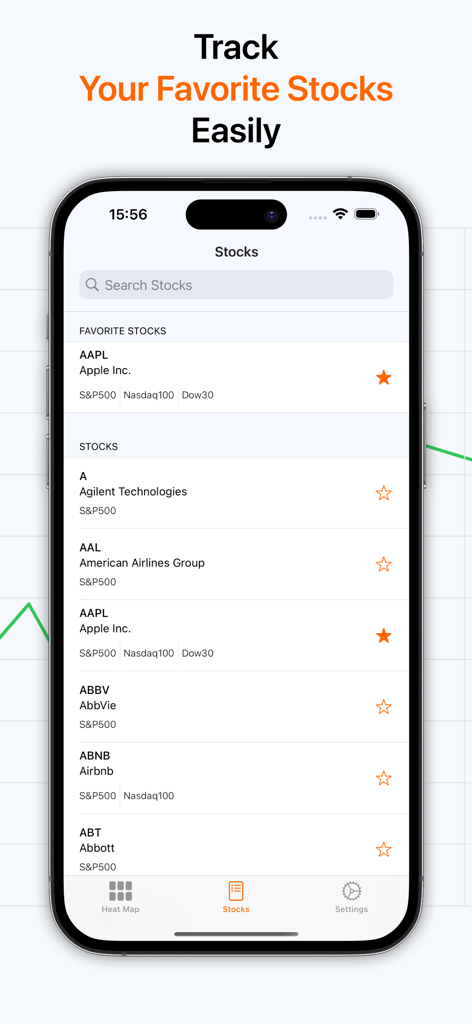
즐겨찾는 주식 목록과 시장 성과 추적을 위한 검색창을 보여주는 모바일 앱 인터페이스.
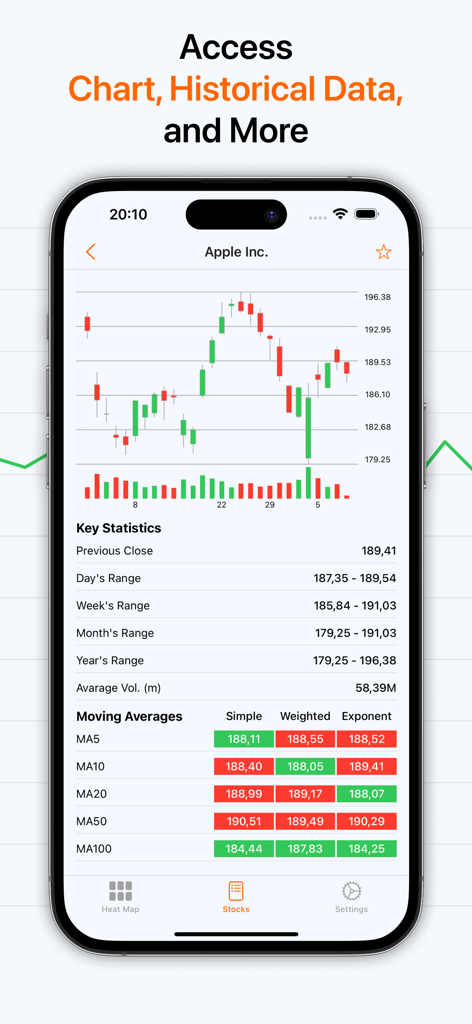
캔들스틱 차트와 이동 평균 표를 보여주는 상세한 주식 기술 분석 화면
정보 기술 주식에 대한 인터랙티브 히트맵을 표시하는 모바일 앱 스크린샷
S&P 500을 위한 색상 코드로 표시된 주식 시장 히트맵을 표시하는 모바일 앱 인터페이스.
설명
Welcome to Stock+, where your financial aspirations take flight. The most popular stock indexes are in your fingers. Explore the stocks sector by sector with interactive visualized map. Look at S&P500, Dow Jones and Nasdaq 100 stock map (heat map, treemap). Whether you're a seasoned investor or just starting on your financial journey, Stock+ is your trusted partner in building a secure and prosperous future.
Features,
- Interactive Stock Map
Easily understand with color-coded according to daily results.
- Deepdive Sector Stocks
Lots of stock in a screen. Click to any sector and new map will draw with that sector stocks. Easy to use and more understandable especially in large number of stock based indexes like S&P 500.
- Stock Detail
Choose the whatever you want stock and get more price information like well-designed candlestick graphic, daily, weekly, monthly, yearly minimum and maximum price movements.
- Favorite Stocks
Add all of your favorite stocks to list and you can easily access with them. The new list will start with your favorite stocks.
- Reliable and Secure
Your privacy and security are our utmost priority. Your favorites are kept in your phone. Holdings are transferred to our database and kept encrypted.
- User-Friendly Interface
Navigate the complexities of investing with ease. Our intuitive interface ensures that you can monitor your investments, track performance, and make informed decisions—all from the palm of your hand.
- Technical Analysis
Follow simple, weighted, exponential daily moving averages in 5, 10, 20, 50, 100, 200 day periods.
- Technical Indicators
Also follow best resulted indicators like RSI, MACD, STOCH, CCI, STOCHRSI, ATR, ADX, OU, ROC, WilliamsR and get easily signals.
- Stock Holdings
How to Work?
The stocks on a map are grouped in hierarchies. A market contains multiple sectors. A sector contains multiple industries. An industry contains multiple stocks.
For example, S&P500 index has 11 sectors (Utilities, Real Estate, Materials, Information Technology, Industrials, Health Care, Financials, Energy, Consumer Staples, Consumer Discretionary, Communication Services). All of sectors can have lots of different industries. Utilities is one of sectors and has 5 different industries (Independent Power Producers & Energy Traders, Electric Utilities, Multi-Utilities, Water Utilities, Gas Utilities). Each utilies has one or more stock.
On the other hand, different indexes has different rules. Dow Jones does not have sectors. It is only divided by industries. It contains 17 different industries (Telecommunications industry, Semiconductor industry, Retailing, Pharmaceutical industry, Petroleum industry, Managed health care, Insurance, Home Improvement, Food industry, Fast-moving consumer goods, Drink industry, Construction, Conglomerate, Clothing industry, Chemical industry, Broadcasting, Biopharmaceutical, Aerospace). Like others, each industries has one or more stock.
Stock Map visualizes the stock market with a market heat map (a.k.a. market treemap). The size of a block is determined by the market cap of that company. And the whole map is sorted by the market cap in descending order.
Subscription and Pricing:
If you choose to purchase, payment will be charged to your iTunes account, and your account will be charged for renewal within 24-hours prior to the end of the current period. Auto-renewal may be turned off at any time by going to your settings in the iTunes Store after purchase. Any unused portion of a free trial period, if offered, will be forfeited when the user purchases a subscription to that publication, where applicable
Current subscription starts from $2.99 USD/month.
Subscriptions can be deactivated at the following link: https://support.apple.com/en-us/HT202039
Privacy Policy: https://kemalbakacak.com/agreements/stock-plus-stock-map-heatmap/privacy_policy.html
Terms of Use: https://kemalbakacak.com/agreements/stock-plus-stock-map-heatmap/terms_and_conditions.html
이 페이지는 앱이나 개발자의 공식 페이지가 아니며, 정보 제공 및 논평을 목적으로 작성된 독립 편집 간행물입니다. 명시적으로 달리 언급되지 않는 한, 해당 앱이나 개발자는 MWM, Apple, Google Play, 앱 퍼블리셔 또는 앱 개발자와 제휴, 보증, 후원, 승인 또는 공식적으로 연결되어 있지 않으며, 이 페이지의 어떤 내용도 해당 앱이 MWM의 서비스를 사용하여 개발되었음을 의미하지 않습니다. 모든 상표, 로고, 스크린샷 및 기타 콘텐츠는 해당 소유자의 자산입니다.