이 페이지는 앱이나 개발자의 공식 페이지가 아니며, 정보 제공 및 논평을 목적으로 작성된 독립 편집 간행물입니다. 명시적으로 달리 언급되지 않는 한, 해당 앱이나 개발자는 MWM, Apple, Google Play, 앱 퍼블리셔 또는 앱 개발자와 제휴, 보증, 후원, 승인 또는 공식적으로 연결되어 있지 않으며, 이 페이지의 어떤 내용도 해당 앱이 MWM의 서비스를 사용하여 개발되었음을 의미하지 않습니다. 모든 상표, 로고, 스크린샷 및 기타 콘텐츠는 해당 소유자의 자산입니다.

Surf Report and Forecast Tool
주관적인 캠 리포트와 신뢰할 수 없는 예보에 시간을 낭비하지 마세요. 실시간 NOAA 스펙트럼 에너지 밀도와 30분 단위의 부표 업데이트를 통해 선호하는 서프 포인트의 정확한 스웰 윈도우를 파악하세요.
다운로드
90K+사용자 평점
총 평가 수
100개발사
카테고리
Weather지원 언어
3최신 버전
2.41크기
9.6 MB출시일
2015년 8월 21일데이터 기반의 서핑 인텔리전스
주관적인 리포트와 복잡한 캠은 이제 잊으세요. 30분마다 기기로 전송되는 전문가 수준의 NOAA 부표 데이터와 스펙트럼 에너지 분석을 확인하세요.
실시간 스펙트럼 분석
가공되지 않은 스펙트럼 밀도 데이터로 바다의 에너지를 해독하세요. 선호하는 포인트의 파도를 만드는 정확한 스웰 주기와 방향의 조합을 식별할 수 있습니다.
스웰 도달 확인
새벽 서핑(dawn patrol)을 헛수고로 만들지 마세요. 6시간 부표 이력을 사용하여 침대에서 일어나기도 전에 스웰이 실제로 도달했는지 확인하세요.
다음 스크린샷과 설명은 앱의 공식 스토어 목록에서 직접 가져온 것이며 앱 개발자의 자산입니다.
앱 스토어
스크린샷
해안 파도 모습과 'Buoys Dont Lie' 슬로건이 있는 Indicators 서핑 예보 앱 시작 화면
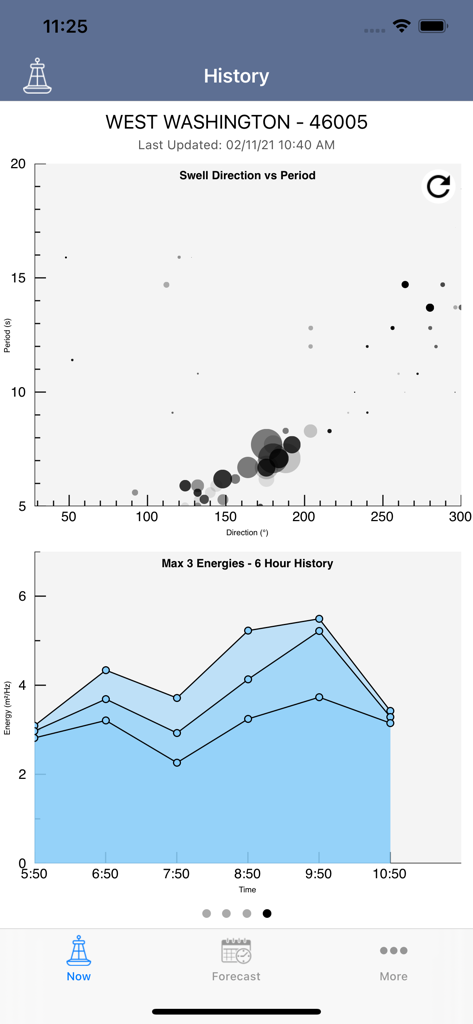
스웰 방향과 에너지 밀도 차트를 보여주는 서핑 예보 앱의 이력 화면
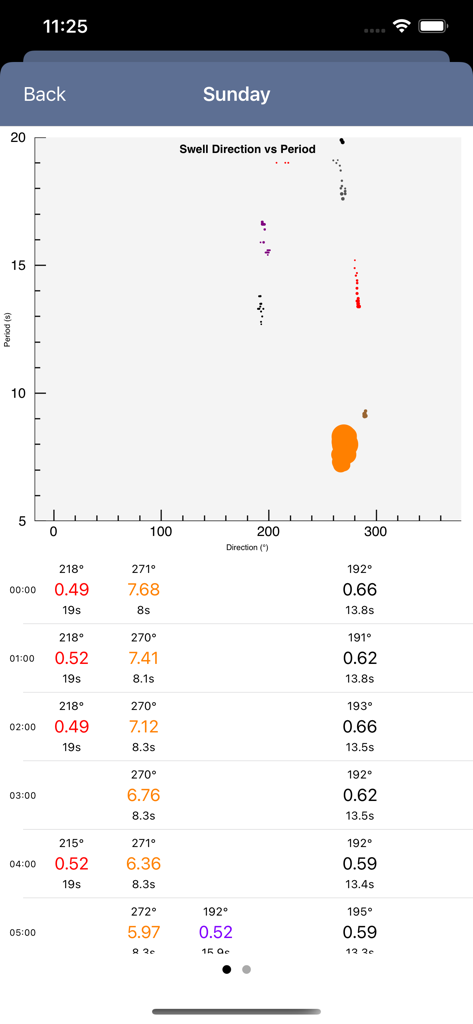
서핑 예보를 위한 상세 시간별 데이터 표와 스웰 방향 대 주기를 보여주는 그래프
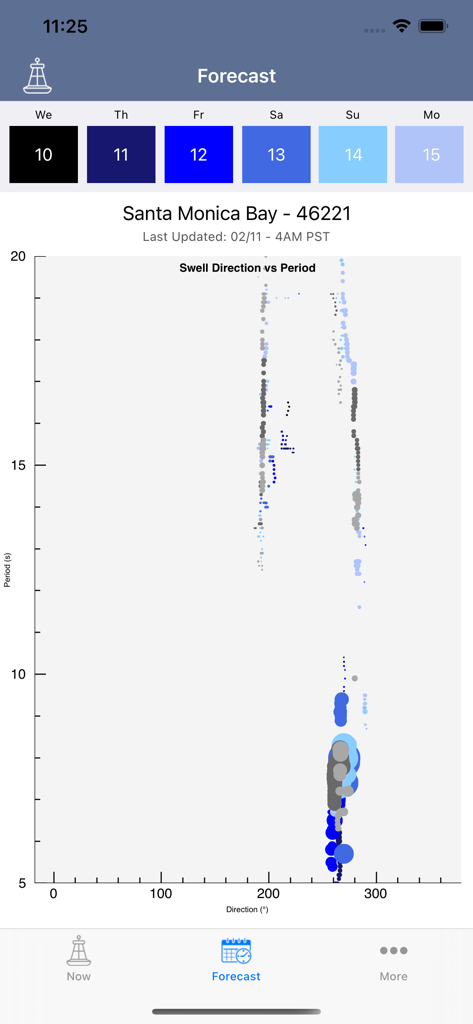
Indicators 앱의 산타모니카 베이 스웰 방향 대 주기 예보 그래프
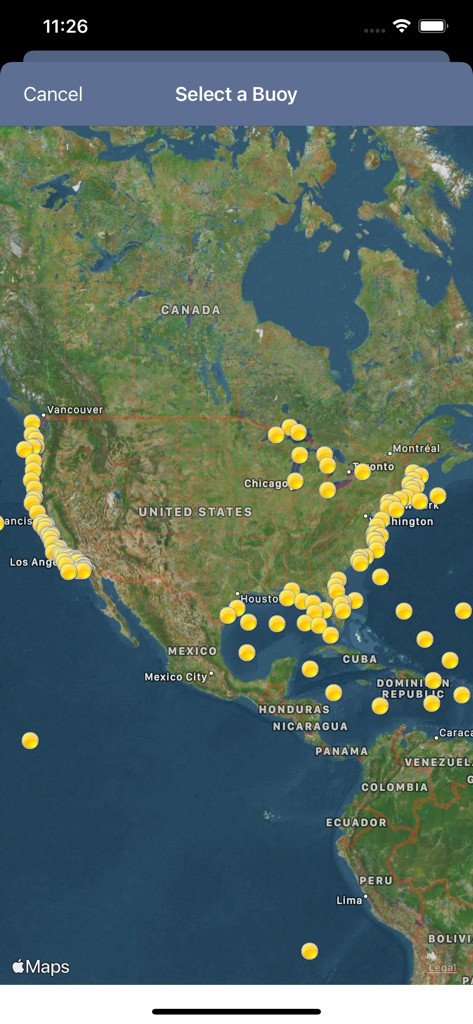
서핑 예보에 사용되는 부표 위치가 노란색 마커로 표시된 북미 위성 지도
설명
Download
비슷한 앱
같은 카테고리의 상위 앱

墨迹天气-MojiWeather
Beijing MojiFengyun Technology Co.,Ltd.

The Weather Channel - Radar
The Weather Channel

Windy.com
Windyty, SE

天气预报-精准15日天气预报
Chongqing Caochen Technology Co., Ltd.

My Aurora Forecast & Alerts
JRustonApps B.V.

AccuWeather: Weather Forecast
AccuWeather International, Inc.

Weather & Radar - Storm radar
WetterOnline - Meteorologische Dienstleistungen GmbH

天气通
Weibo Internet Technology (China) Co.Ltd.

The Thermometer -Digital-
Vida Apps Incorporated
이 페이지는 앱이나 개발자의 공식 페이지가 아니며, 정보 제공 및 논평을 목적으로 작성된 독립 편집 간행물입니다. 명시적으로 달리 언급되지 않는 한, 해당 앱이나 개발자는 MWM, Apple, Google Play, 앱 퍼블리셔 또는 앱 개발자와 제휴, 보증, 후원, 승인 또는 공식적으로 연결되어 있지 않으며, 이 페이지의 어떤 내용도 해당 앱이 MWM의 서비스를 사용하여 개발되었음을 의미하지 않습니다. 모든 상표, 로고, 스크린샷 및 기타 콘텐츠는 해당 소유자의 자산입니다.