This page is not an official page of the app or its developer, but an independent editorial publication created for informational and commentary purposes. Unless expressly stated otherwise, neither the app nor its developer is affiliated with, endorsed by, sponsored by, authorized by, or otherwise officially connected with MWM, Apple, Google Play, the app publisher, or the app's developer, and nothing on this page implies that the app was developed using MWM's services. Any trademarks, logos, screenshots, and other content remain the property of their respective owners.

Easy Dashboard for Indicators
Stop wasting hours on manual chart scanning. Get a professional bird’s-eye view of the market and receive customizable alerts so you never miss a trade—even when you’re on the go.
Downloads
20K+User Rating
Total Ratings
1K+Publisher
Category
FinanceLocales
1Latest Version
5.4.1Size
96.5 MBFirst Released
Sep 7, 2017Master the Markets with Professional Clarity
Stop wrestling with cluttered charts. Our intelligent dashboard distills complex market data into actionable insights, allowing you to trade with confidence from anywhere.
All-in-One Dashboard
Monitor multiple technical indicators and currency pairs on a single screen to eliminate analysis paralysis and identify trends at a glance.
Smart Alerts+
Set fully customizable notifications based on your specific strategy parameters so you never miss a high-probability setup while you're on the go.
The following screenshots and description are sourced directly from the app's official store listing and are the property of the app developer.
App Store
Screenshots
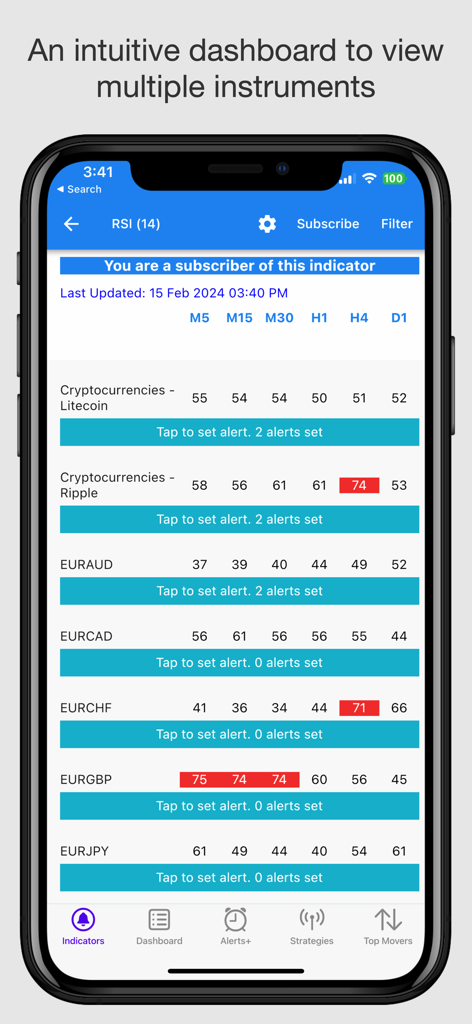
Easy Dashboard app interface showing RSI technical indicator values for multiple financial instruments across various timeframes
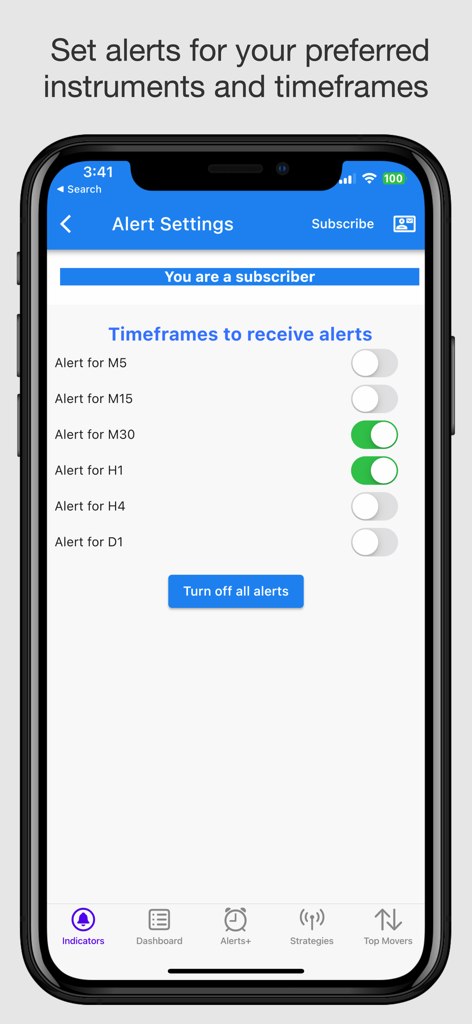
Alert settings screen for customizing trading indicator notifications across multiple timeframes.
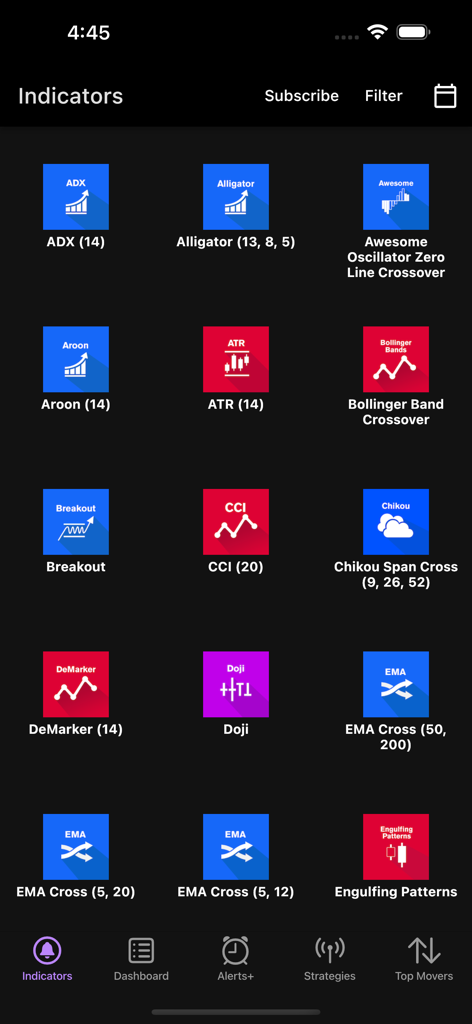
Mobile screen displaying a list of technical trading indicators including ADX, Alligator, and Bollinger Bands crossover
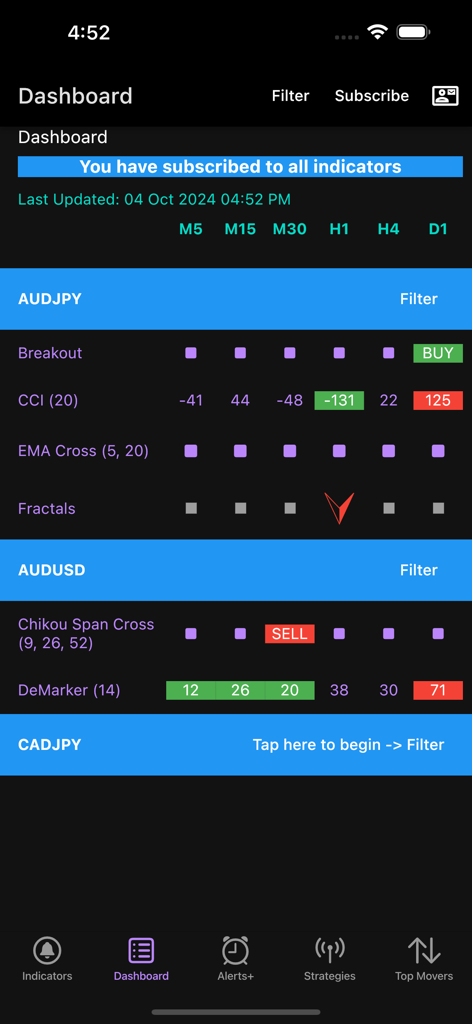
Mobile dashboard showing real-time technical indicators for currency trading
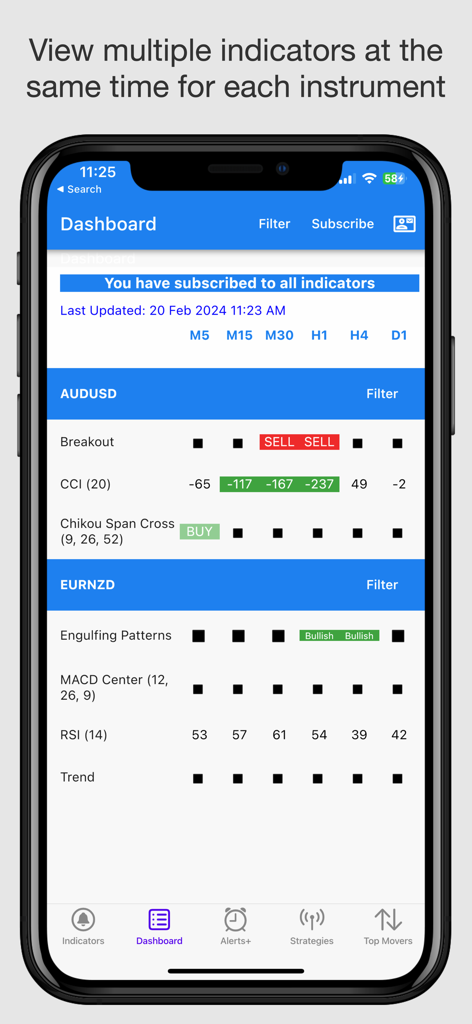
Mobile dashboard displaying multiple technical trading indicators for currency pairs like AUDUSD and EURNZD
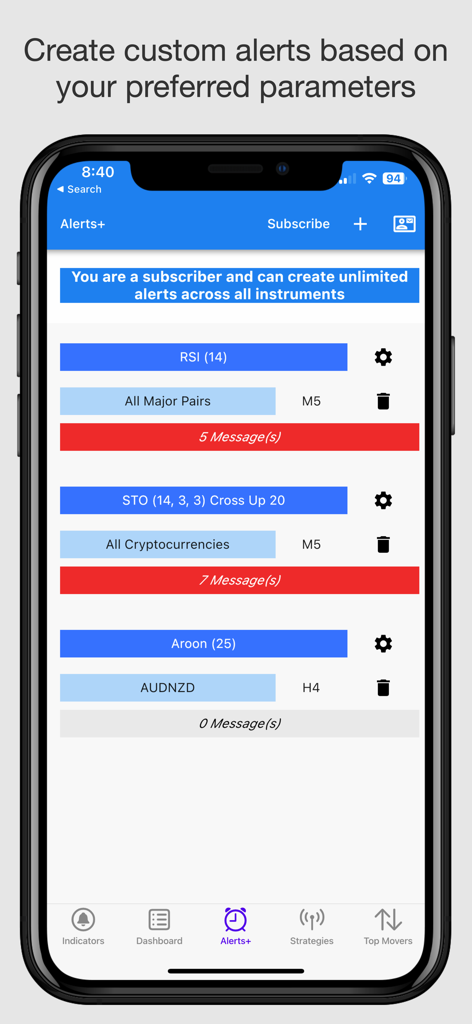
A mobile app interface showing the Alerts plus feature for custom trading indicator notifications.
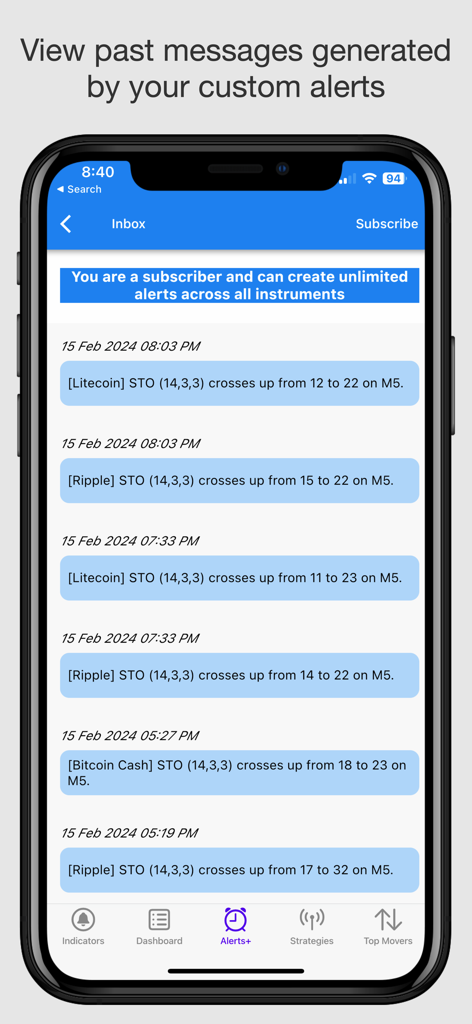
Mobile app screen showing a list of past trading alerts for cryptocurrency indicators
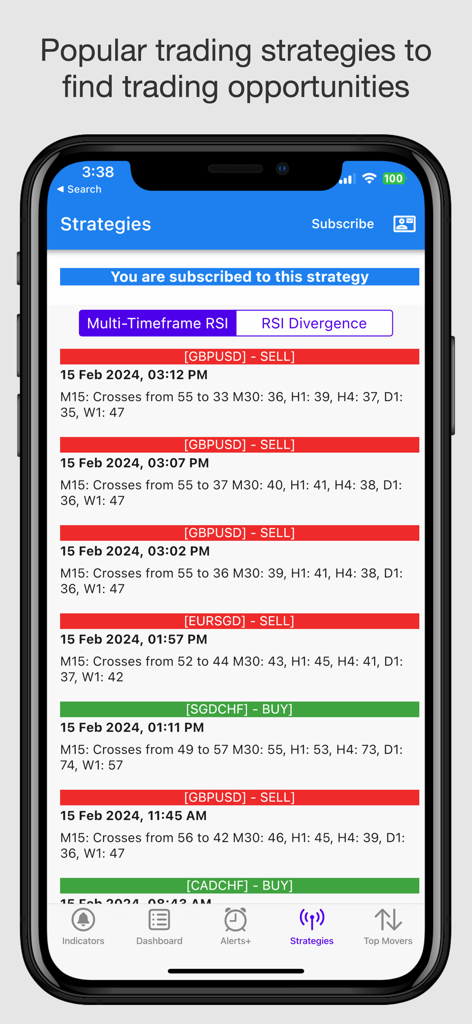
Easy Dashboard mobile app screen displaying buy and sell signals for various currency pairs based on popular trading strategies
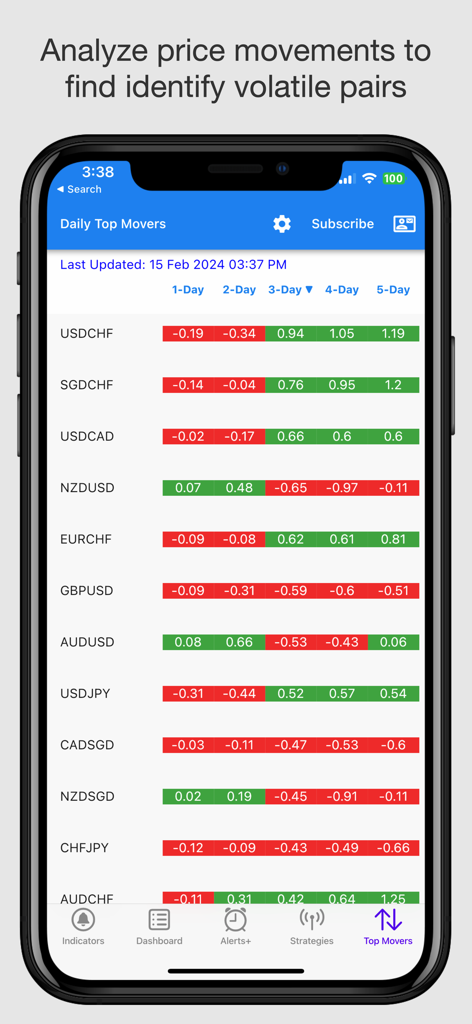
Mobile app interface displaying daily top movers for forex currency pairs with multi-day price changes
Description
Download
More Like This
Apps with similar features and user experience

Into the Cryptoverse
BC Analytics, LLC

Questrade Edge Mobile
Questrade Inc.

Realtime Stock Screener
Maxim Golokhov

Flow Greeks : Unusual Options
Flow Greeks LLC

Unusual Whales
Unusual Whales Inc

Super Stocks with Options
Mobile Interactive LLC

Ave Pro
AVE AI DATA AU TECHNOLOGY PTY LTD

Option Signal Alert
KYOTO K.K.

OptionsFlow
Asian Digital Mind Limited
This page is not an official page of the app or its developer, but an independent editorial publication created for informational and commentary purposes. Unless expressly stated otherwise, neither the app nor its developer is affiliated with, endorsed by, sponsored by, authorized by, or otherwise officially connected with MWM, Apple, Google Play, the app publisher, or the app's developer, and nothing on this page implies that the app was developed using MWM's services. Any trademarks, logos, screenshots, and other content remain the property of their respective owners.