This page is not an official page of the app or its developer, but an independent editorial publication created for informational and commentary purposes. Unless expressly stated otherwise, neither the app nor its developer is affiliated with, endorsed by, sponsored by, authorized by, or otherwise officially connected with MWM, Apple, Google Play, the app publisher, or the app's developer, and nothing on this page implies that the app was developed using MWM's services. Any trademarks, logos, screenshots, and other content remain the property of their respective owners.

Light Pollution Map
Harness professional VIIRS data, Bortle class estimations, and real-time aurora forecasts to find the perfect spot for astronomy and astrophotography, even offline.
Downloads
161K+User Rating
Total Ratings
0Publisher
Category
NavigationLocales
1Latest Version
1.1.29Size
19.9 MBFirst Released
Sep 20, 2020Master the Night Sky with Precision Tools
Plan your next astrophotography or stargazing trip using scientific-grade radiance maps, real-time cloud tracking, and global SQM data.
Advanced Light Pollution Overlays
Access VIIRS, World Atlas, and user-submitted SQM measurements to find the darkest Bortle class locations with scientific accuracy.
Real-Time Sky Conditions
Stay ahead of the weather with cloud cover animations and Aurora forecasts, ensuring perfect visibility for your night of observation.
The following screenshots and description are sourced directly from the app's official store listing and are the property of the app developer.
App Store
Screenshots
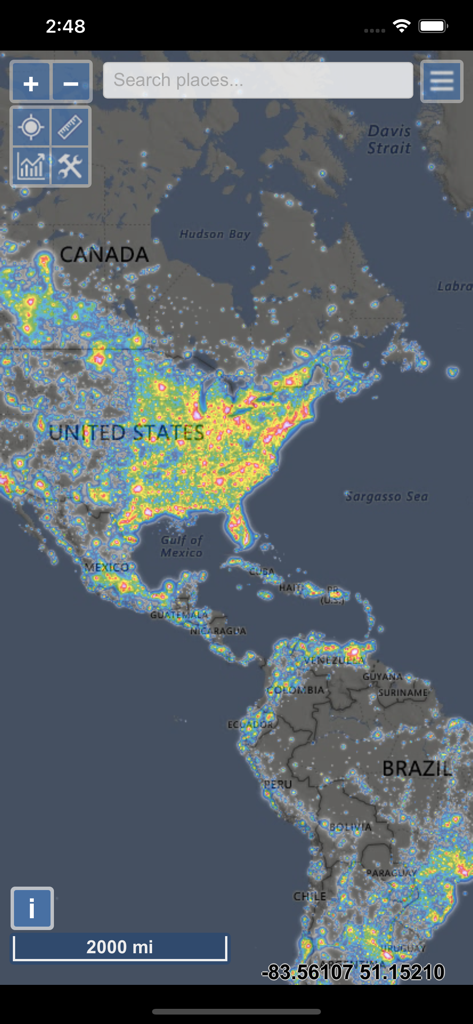
Light pollution heatmap of North and South America in the app interface
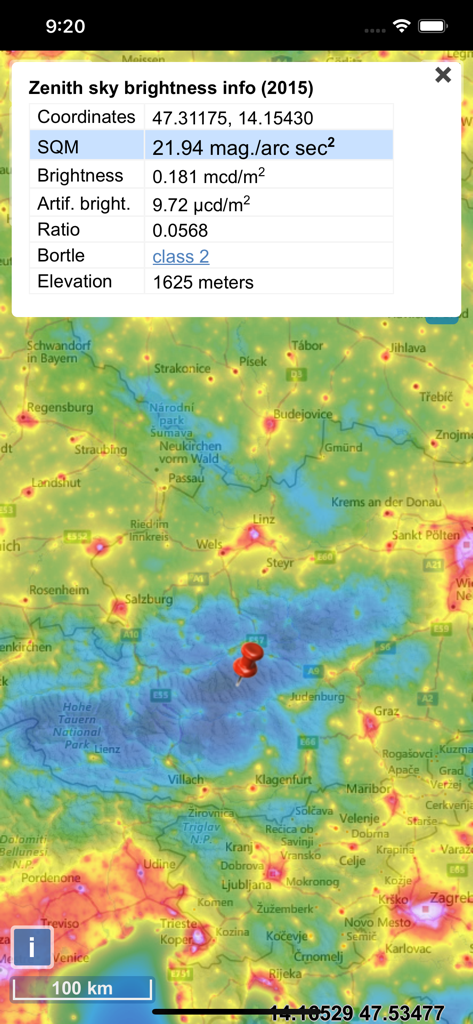
Interface of light pollution map showing sky brightness and Bortle class data
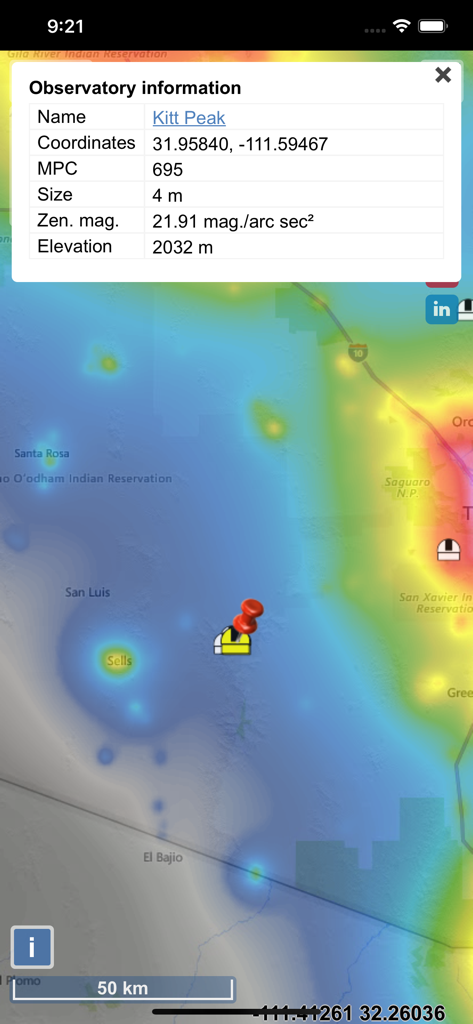
Map display showing light pollution levels and details for Kitt Peak observatory.
Light Pollution Map interface displaying SQM sky quality readings and a light intensity heat map overlay
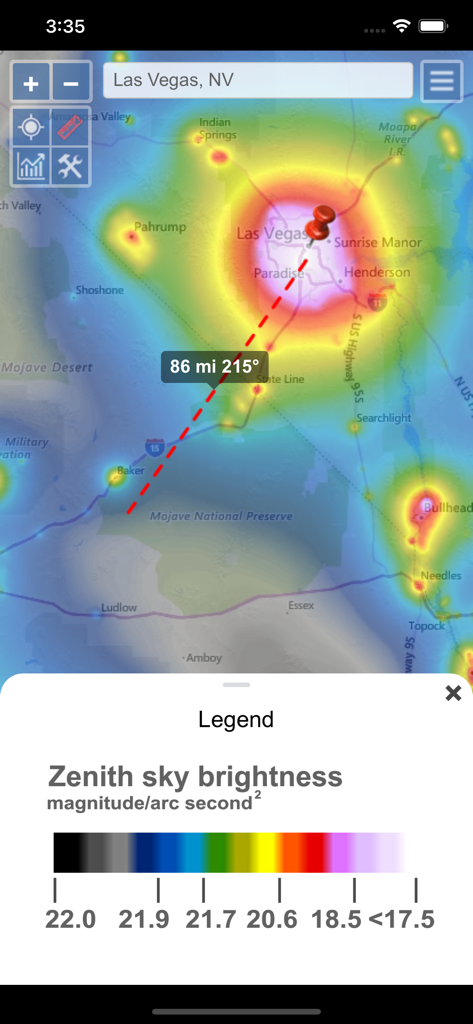
A light pollution map of the Las Vegas area showing Zenith sky brightness levels with a distance measurement tool pointing towards Mojave National Preserve.
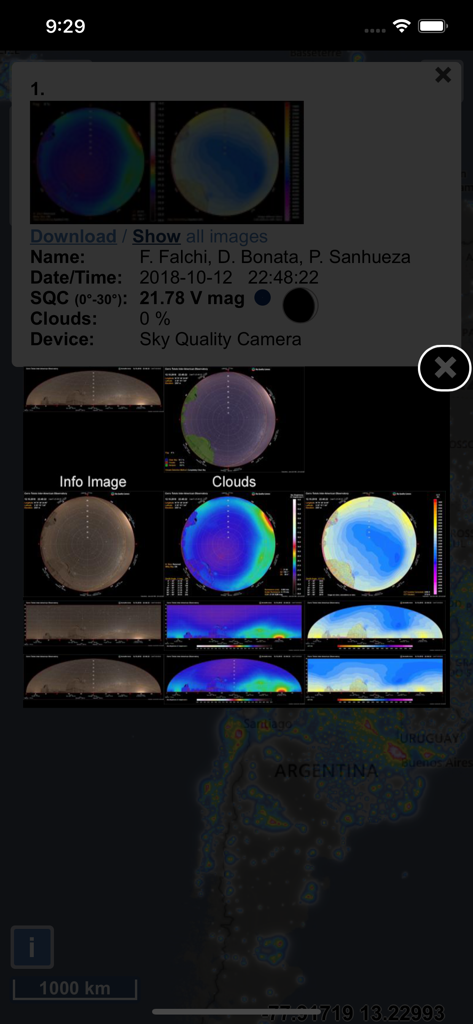
Detailed sky quality camera metrics and light pollution data overlay on a map.
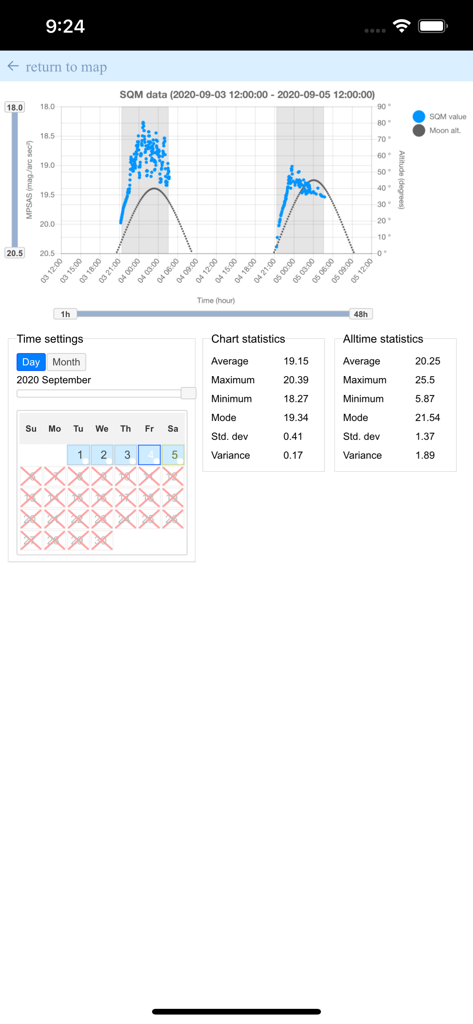
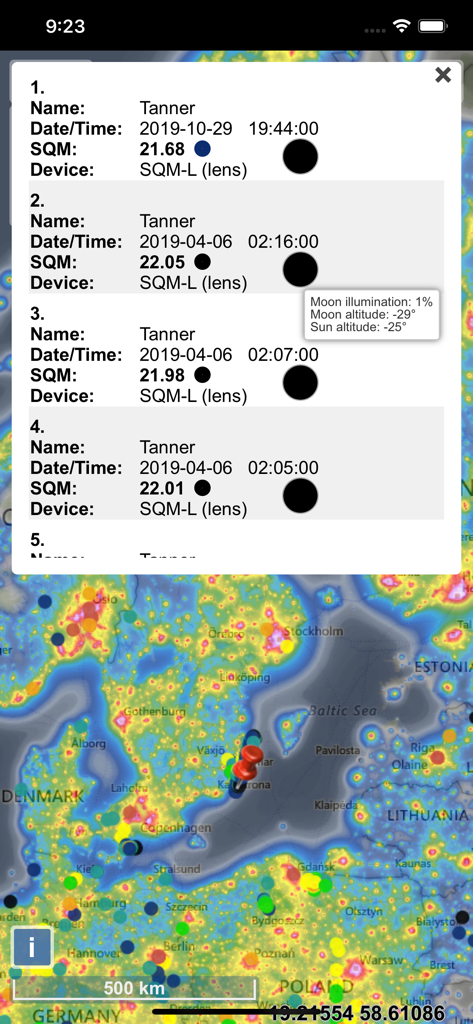
Statistical chart of Sky Quality Meter data and moon altitude over time
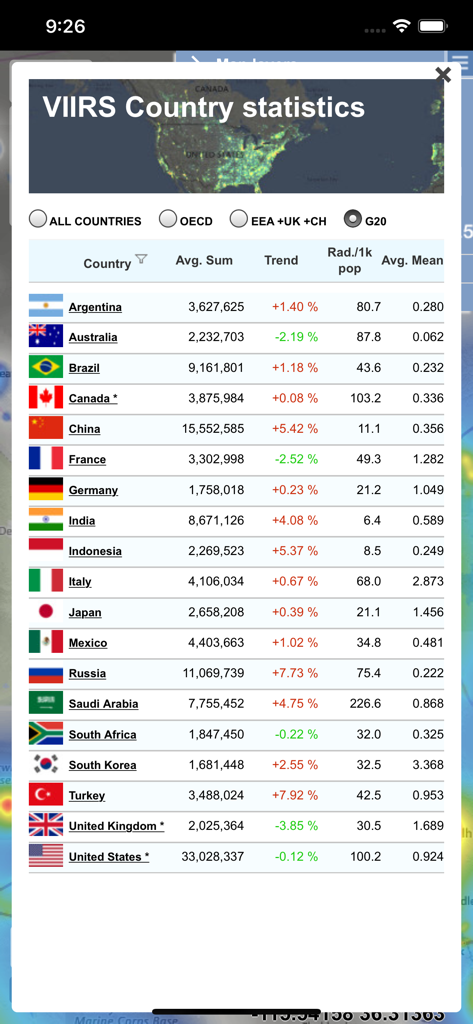
A data table showing light pollution statistics and radiance trends by country within the Light Pollution Map app.
Description
Download
More Like This
Apps with similar features and user experience

Moon Phases and Lunar Calendar
Business City s.r.o.

My Moon Phase - Lunar Calendar
JRustonApps B.V.

The Moon: Calendar Moon Phases
Vitalii Gryniuk

Moonlitt: Moon Phase Tracker
Flipping Hues Srls

Sunrise Sunset Times
Fascinating Projects Pty Ltd

PhotoPills
PhotoPills S.L.

AuroraReach
HuskyCodes Oy

Sun Seeker - Sunlight Tracker
Ajnaware Pty Ltd

Sun Tracker AR
Zuzana Eskinasi
This page is not an official page of the app or its developer, but an independent editorial publication created for informational and commentary purposes. Unless expressly stated otherwise, neither the app nor its developer is affiliated with, endorsed by, sponsored by, authorized by, or otherwise officially connected with MWM, Apple, Google Play, the app publisher, or the app's developer, and nothing on this page implies that the app was developed using MWM's services. Any trademarks, logos, screenshots, and other content remain the property of their respective owners.