This page is not an official page of the app or its developer, but an independent editorial publication created for informational and commentary purposes. Unless expressly stated otherwise, neither the app nor its developer is affiliated with, endorsed by, sponsored by, authorized by, or otherwise officially connected with MWM, Apple, Google Play, the app publisher, or the app's developer, and nothing on this page implies that the app was developed using MWM's services. Any trademarks, logos, screenshots, and other content remain the property of their respective owners.

Stock Screener Pro - Technical
Stop checking charts one by one. Combine multiple indicators like MACD, RSI, and Candlestick patterns to filter the entire US market in seconds—data-driven research designed for your evening ritual.
Downloads
100K+User Rating
Total Ratings
0Publisher
Category
FinanceLocales
1Latest Version
1.6Size
8.6 MBFirst Released
Dec 2, 2015Master the Market with Precision Technical Scanning
Save hours of manual research by filtering thousands of US stocks through advanced technical indicators tailored for the disciplined swing trader.
Multi-Indicator Power Scanning
Combine multiple technical signals like MACD, RSI, and price volume into a single scan to find high-probability trade setups in seconds.
Built for your Evening Ritual
Perfect for busy professionals. Use reliable end-of-day data to plan your trades after work without the pressure of real-time market noise.
The following screenshots and description are sourced directly from the app's official store listing and are the property of the app developer.
App Store
Screenshots
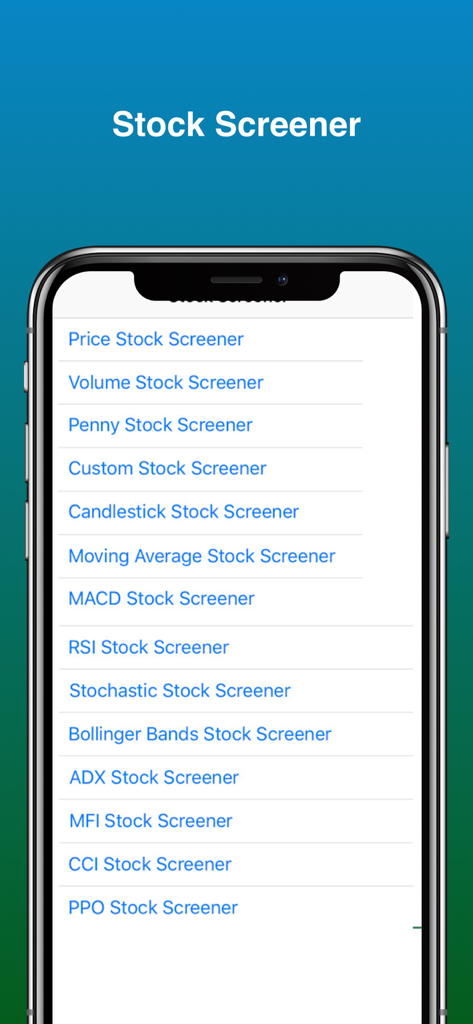
Main menu of Stock Screener Pro showing technical analysis indicators like MACD, RSI, and Bollinger Bands
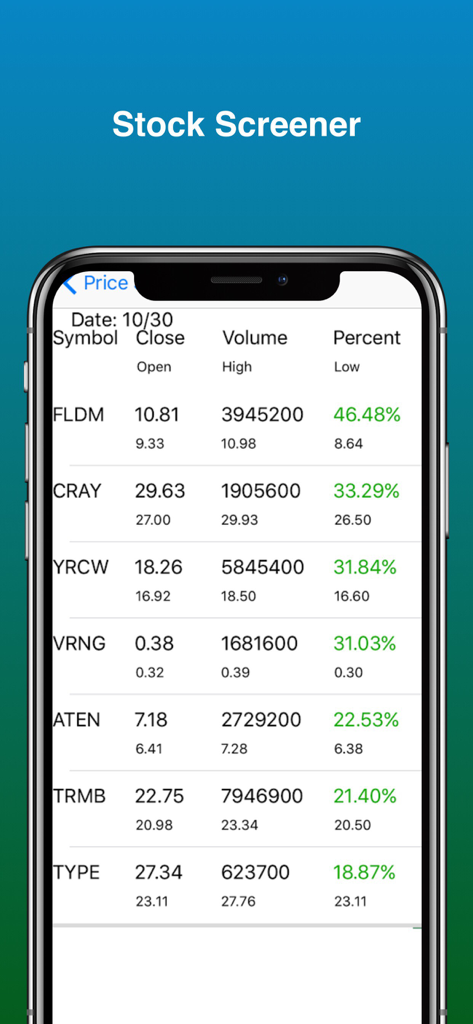
List of top stock gainers with price and volume data on Stock Screener Pro app
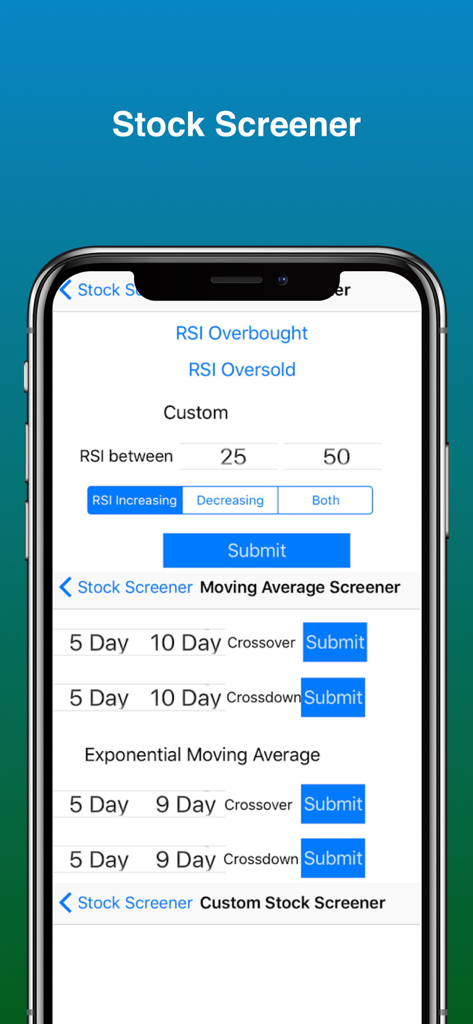
Interface of Stock Screener Pro app displaying technical analysis tools and RSI filter settings
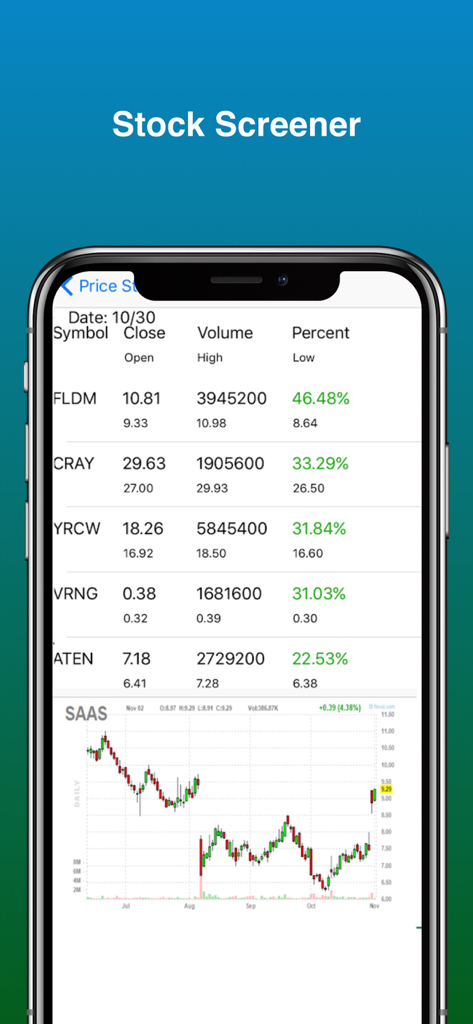
Stock Screener Pro app showing a list of stocks and a technical candlestick chart
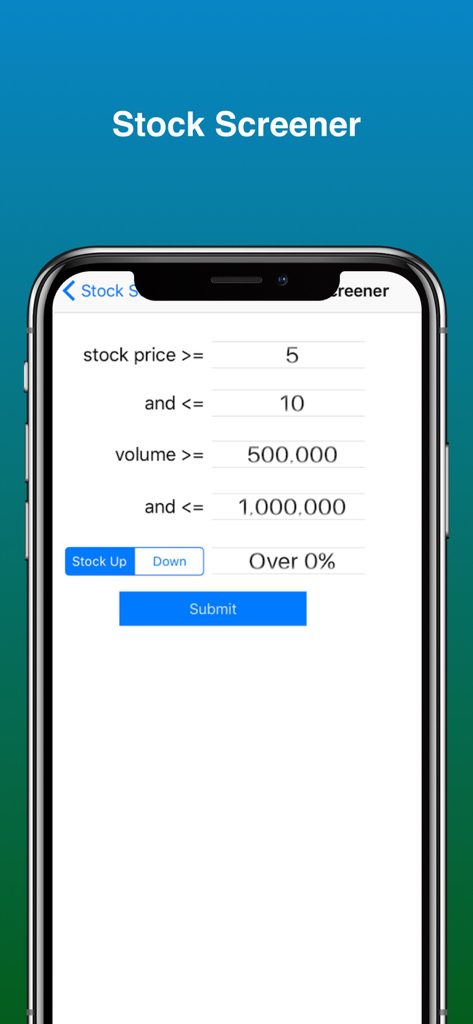
Interface for setting stock price and volume filters in Stock Screener Pro
Description
Download
More Like This
Top-ranked apps in the same category

电子税务局
State Administration of Taxation

UnionPay APP
China Unionpay Co.,Ltd.

养基宝 - 年轻人的养基神器
Shenzhen Xiaoduotou Information Technology Co.,Ltd.

PayPal - Pay, Send, Save
PayPal, Inc.

中国农业银行
AGRICULTURAL BANK OF CHINA LIMITED

Mercado Pago: cuenta digital
MercadoLibre S.A.

Kalshi: Trade on the Big Game
KALSHI INC.

中国工商银行
Industrial and Commercial Bank of China

个人所得税
State Administration of Taxation
This page is not an official page of the app or its developer, but an independent editorial publication created for informational and commentary purposes. Unless expressly stated otherwise, neither the app nor its developer is affiliated with, endorsed by, sponsored by, authorized by, or otherwise officially connected with MWM, Apple, Google Play, the app publisher, or the app's developer, and nothing on this page implies that the app was developed using MWM's services. Any trademarks, logos, screenshots, and other content remain the property of their respective owners.