このページはアプリまたはその開発者の公式ページではなく、情報提供および論評を目的として作成された独立した編集出版物です。明示的に別段の記載がない限り、アプリおよびその開発者は、MWM、Apple、Google Play、アプリのパブリッシャー、またはアプリの開発者と提携、承認、後援、認可、またはその他の公式的な関係はなく、このページのいかなる内容も、アプリがMWMのサービスを使用して開発されたことを意味するものではありません。すべての商標、ロゴ、スクリーンショット、その他のコンテンツはそれぞれの所有者の財産です。

Noise Monitor and Analysis
憶測はやめて、記録を始めましょう。12時間以上の騒音を簡単に録音し、視覚的な色分けで繰り返されるパターンを特定し、近隣トラブルや管理組合の苦情を解決するための位置情報検証済みレポートを作成します。
ダウンロード
20K+ユーザー評価
評価数
0開発元
カテゴリ
Lifestyle対応言語
1最新バージョン
3.8.3サイズ
68.6 MBリリース日
2015年11月6日すべてのデシベルを精密に記録
主観的な迷惑行為を客観的なデータに変えます。当社の高度な監視ツールは、騒音障害のキャプチャ、分析、証明を容易にします。
12時間以上の連続録音
夜通し、または勤務時間中ずっと監視できます。最適化されたバックグラウンド録音により、バッテリーを消耗させることなく長期間の証拠をキャプチャします。
視覚的なサウンドマッピング
色分けされた周波数分析で、パターンを即座に特定します。無音区間をスキップし、高速レビュー機能を使用して、重要なイベントを数秒で見つけることができます。
以下のスクリーンショットと説明は、アプリの公式ストアリスティングから直接取得されたものであり、アプリ開発者の所有物です。
アプリストア
スクリーンショット
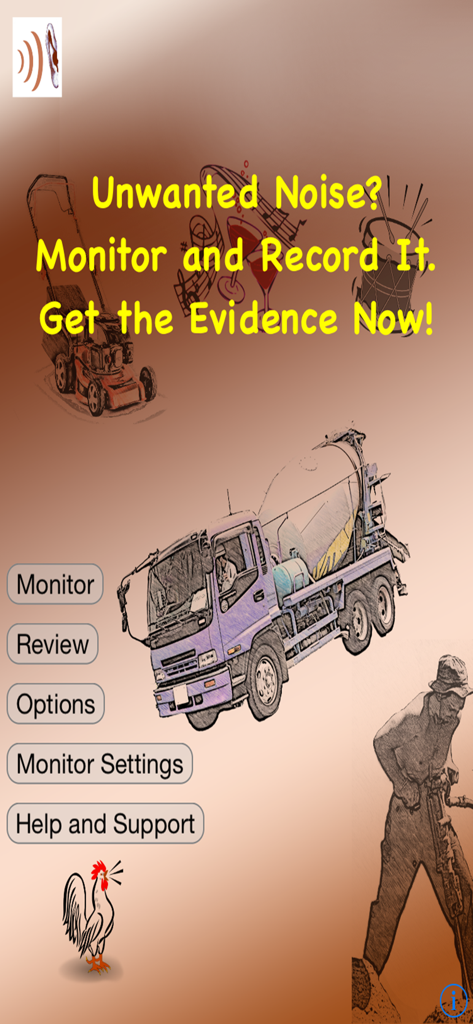
騒音証拠を録音するための騒音モニターと分析アプリのインターフェース
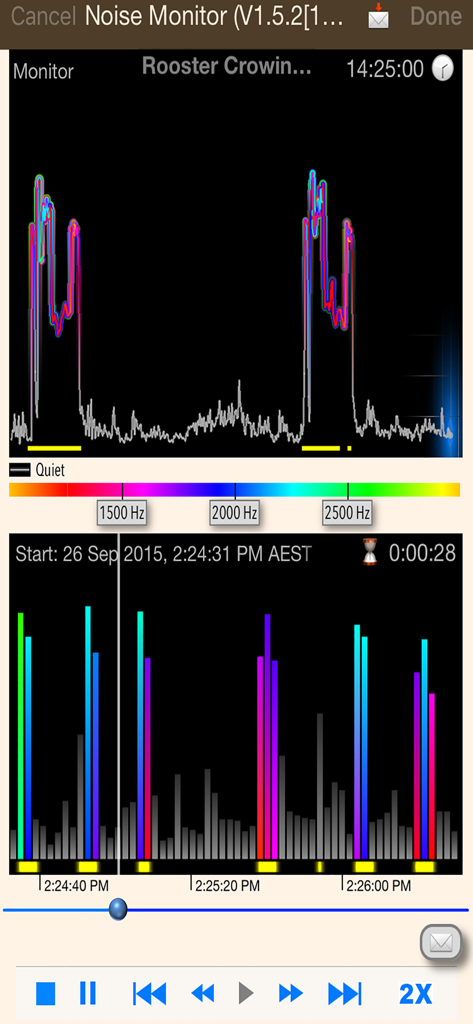
騒音証拠収集のための色分けされたオーディオ周波数グラフを表示する騒音モニターと分析アプリのインターフェース
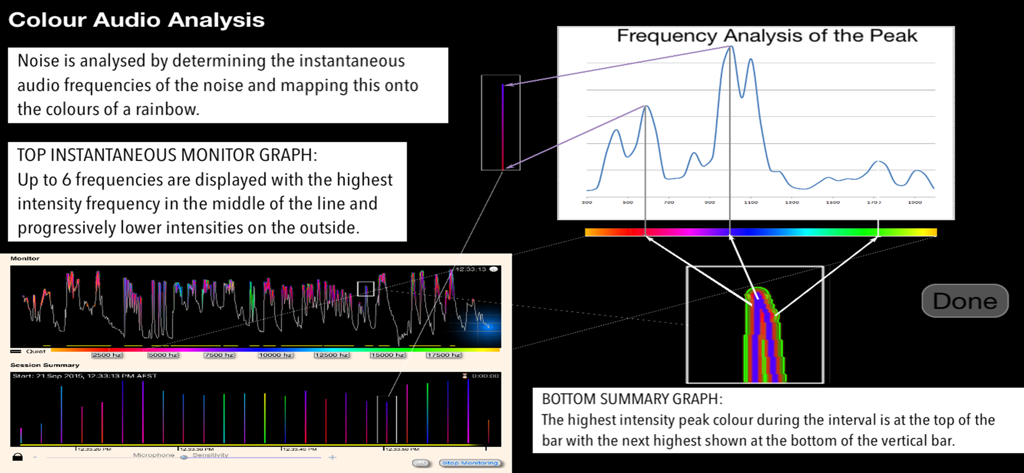
周波数分析と色分けされたデータを含むセッション概要グラフを表示する騒音モニターアプリの視覚的インターフェース
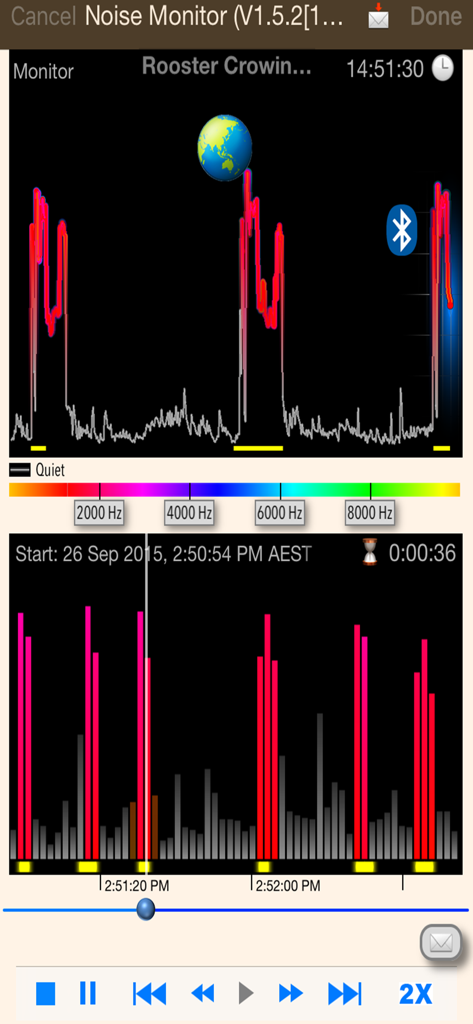
リアルタイムの音響周波数分析と視覚的なセッション概要を表示する騒音モニターアプリのインターフェース
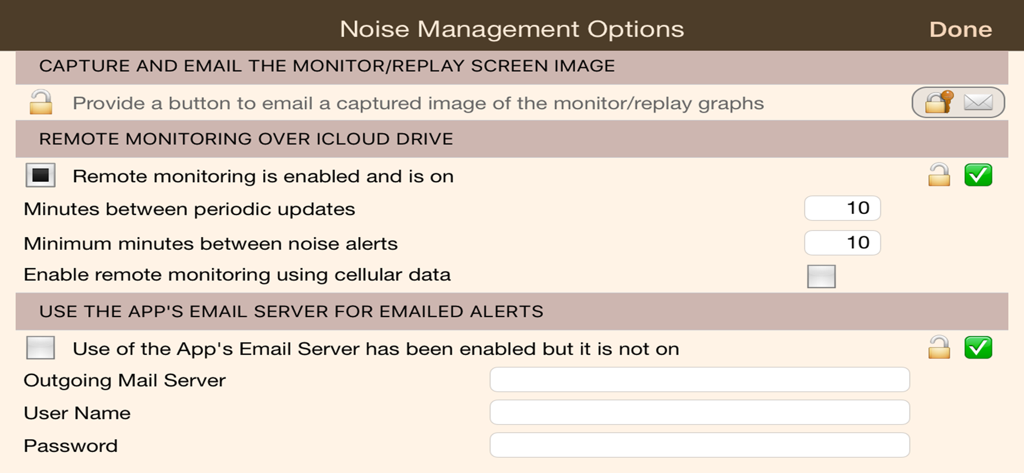
iCloud経由のリモート監視とメールアラート設定を表示する騒音管理オプション画面
説明
Download
類似アプリ
同じカテゴリのトップランクアプリ

Pinterest, Inc.

Alipay - Simplify Your Life
Alipay (Hangzhou) Technology Co., Ltd.

Dianping: Discover Good Places
Hanhai Information Technology (Shanghai) Co.Ltd

美团-美好生活小帮手
Sankuai Technology Co., Ltd.

Lemon8 - Lifestyle Community
TIKTOK PTE. LTD.

Xiaomi Home
Beijing Xiaomi Co., Ltd

Tinder Dating App: Date & Chat
Tinder LLC

SmartThings
Samsung Electronics Co., Ltd.

VNeTraffic
GLOBAL TECHNOLOGY - TELECOMMUNICATIONS CORPORATION
このページはアプリまたはその開発者の公式ページではなく、情報提供および論評を目的として作成された独立した編集出版物です。明示的に別段の記載がない限り、アプリおよびその開発者は、MWM、Apple、Google Play、アプリのパブリッシャー、またはアプリの開発者と提携、承認、後援、認可、またはその他の公式的な関係はなく、このページのいかなる内容も、アプリがMWMのサービスを使用して開発されたことを意味するものではありません。すべての商標、ロゴ、スクリーンショット、その他のコンテンツはそれぞれの所有者の財産です。