このページはアプリまたはその開発者の公式ページではなく、情報提供および論評を目的として作成された独立した編集出版物です。明示的に別段の記載がない限り、アプリおよびその開発者は、MWM、Apple、Google Play、アプリのパブリッシャー、またはアプリの開発者と提携、承認、後援、認可、またはその他の公式的な関係はなく、このページのいかなる内容も、アプリがMWMのサービスを使用して開発されたことを意味するものではありません。すべての商標、ロゴ、スクリーンショット、その他のコンテンツはそれぞれの所有者の財産です。

Teaching Graphs
生徒たちが自分の世界を視覚化できるようにしましょう。ベン図から円グラフまで、Teaching Graphsは、スプレッドシートの複雑さなしに、若い学習者にとってデータリテラシーを楽しく、アクセスしやすいものにします。
ダウンロード
87K+ユーザー評価
評価数
0開発元
カテゴリ
Education対応言語
1最新バージョン
1.43サイズ
18.4 MBリリース日
2012年8月23日子供たちのデータリテラシー能力を強化する
生徒たちがプロフェッショナルソフトウェアの複雑さではなく、グラフの論理に集中できる、気を散らすことのない環境。
簡単なグラフ作成
スプレッドシートは不要です。直感的なドラッグ&ドロップツールで、カラフルなベン図、キャロル図、円グラフを作成できます。
実世界のデータ読解
今日の天気データや、初学者向けのわかりやすいデータセットを解釈することで、批判的思考力を養います。
以下のスクリーンショットと説明は、アプリの公式ストアリスティングから直接取得されたものであり、アプリ開発者の所有物です。
アプリストア
スクリーンショット
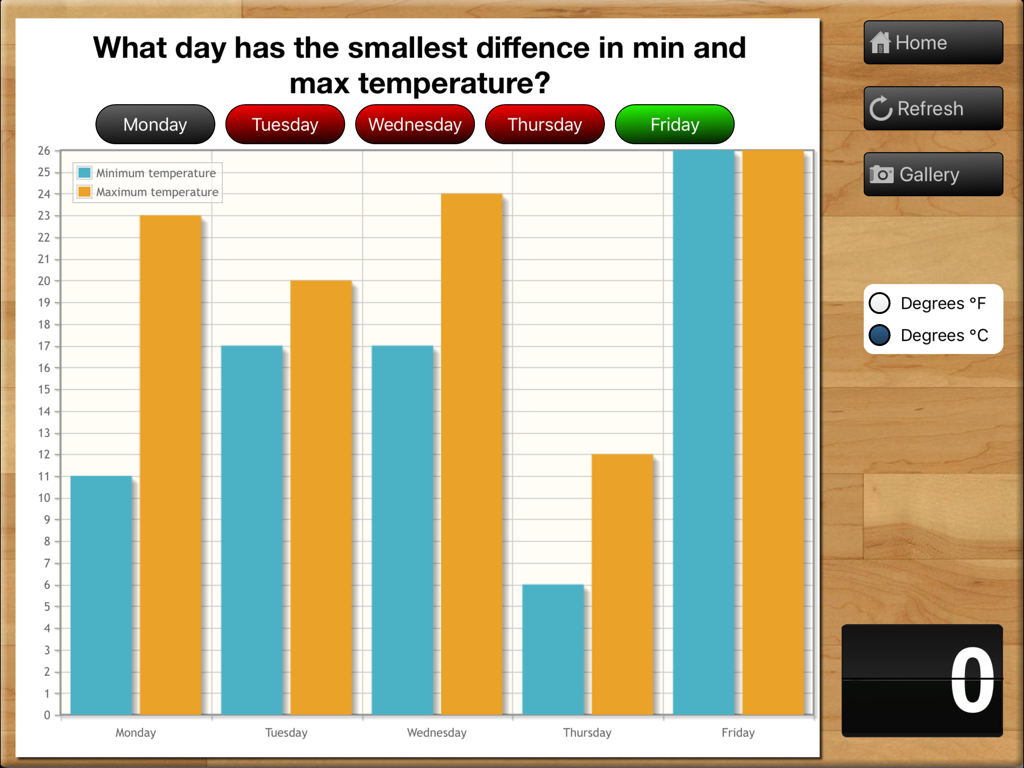
5日間の学校週の最低気温と最高気温の比較を示す教育的な棒グラフ。
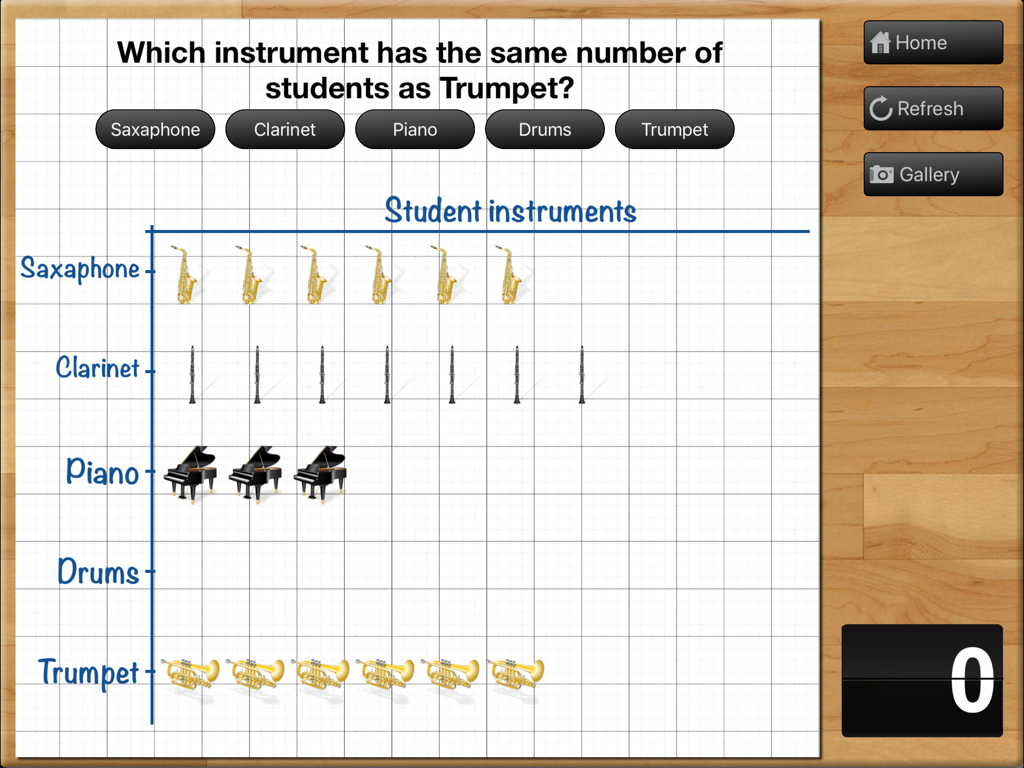
Teaching Graphs iPadアプリ内のグリッド上に楽器を持つ生徒のデータを示す絵グラフ
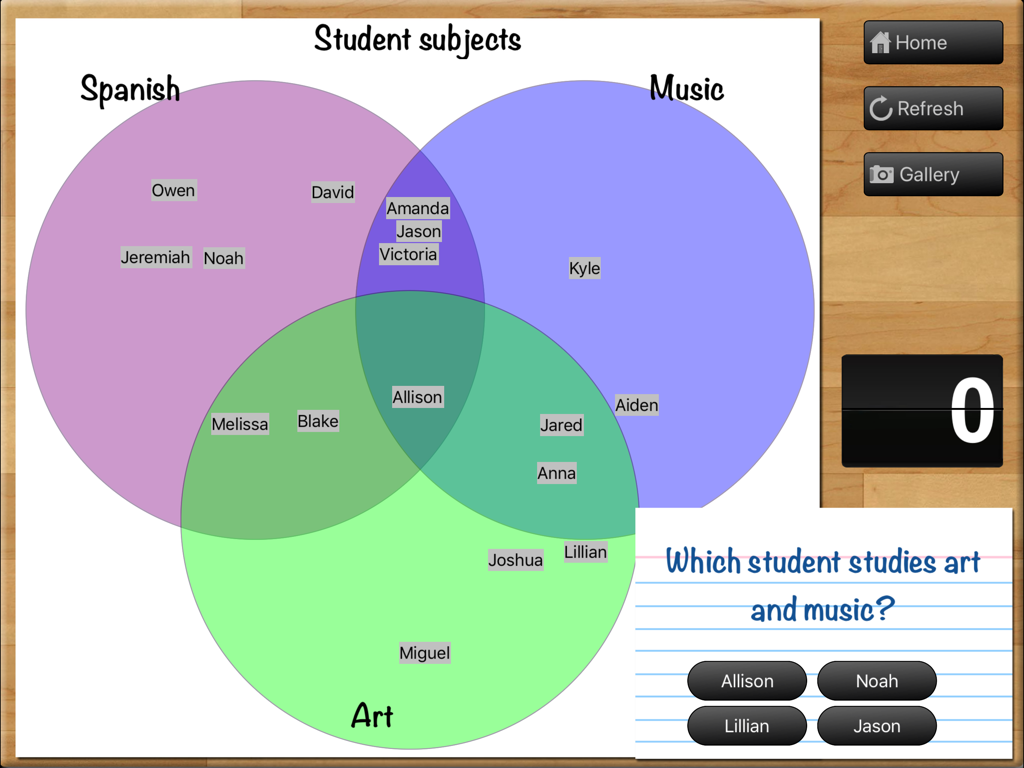
Teaching Graphsアプリ内の3つの円で構成されるベン図。スペイン語、音楽、美術の重なり合うカテゴリに関するクイズに使用されます。
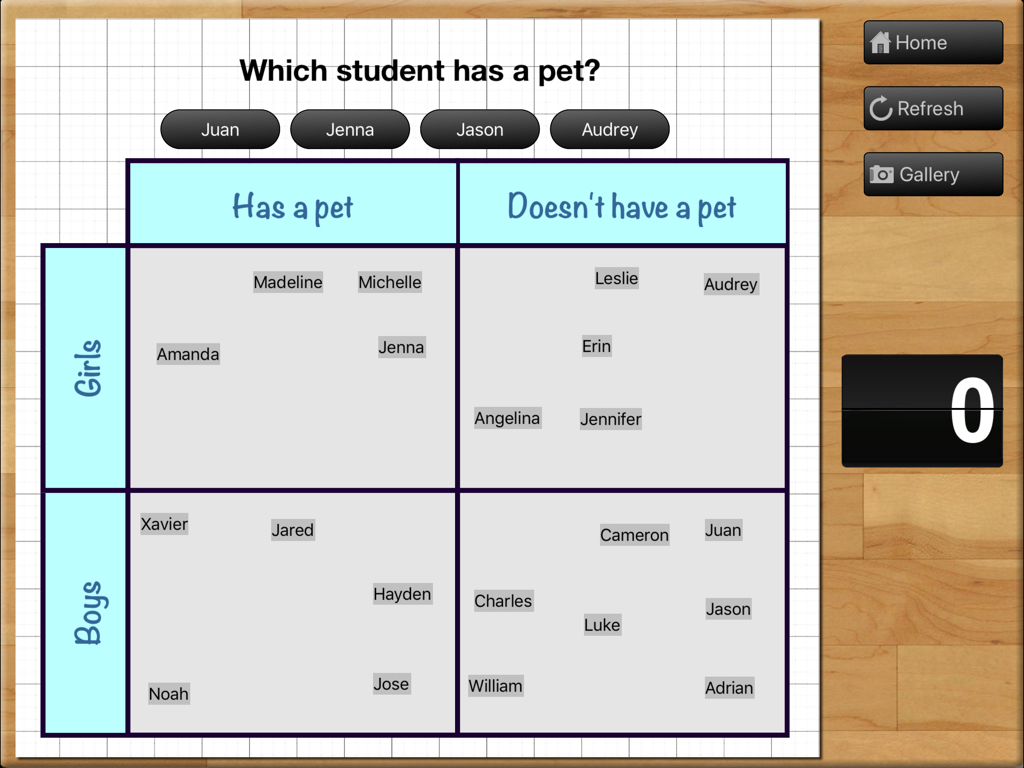
Teaching Graphsアプリ内のキャロル図アクティビティ。ペットの所有状況で少年少女を分類するためのグリッドを示します。
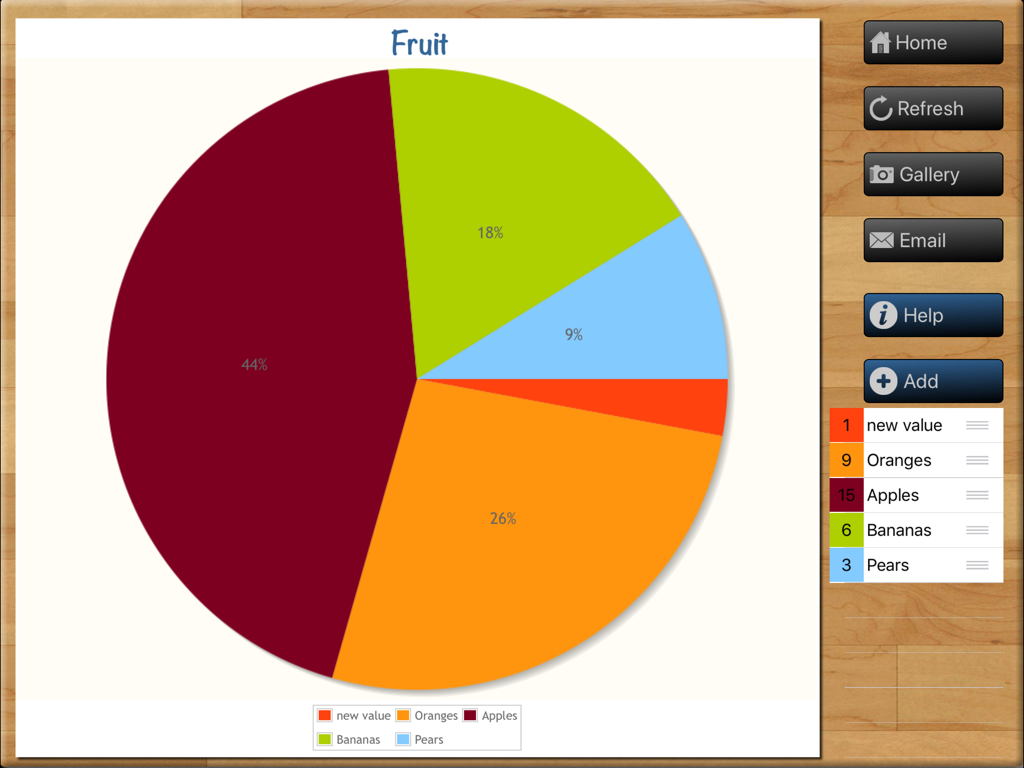
Teaching Graphs教育用iPadアプリで作成中の果物をテーマにした円グラフ。リンゴ、オレンジ、バナナのデータを示します。
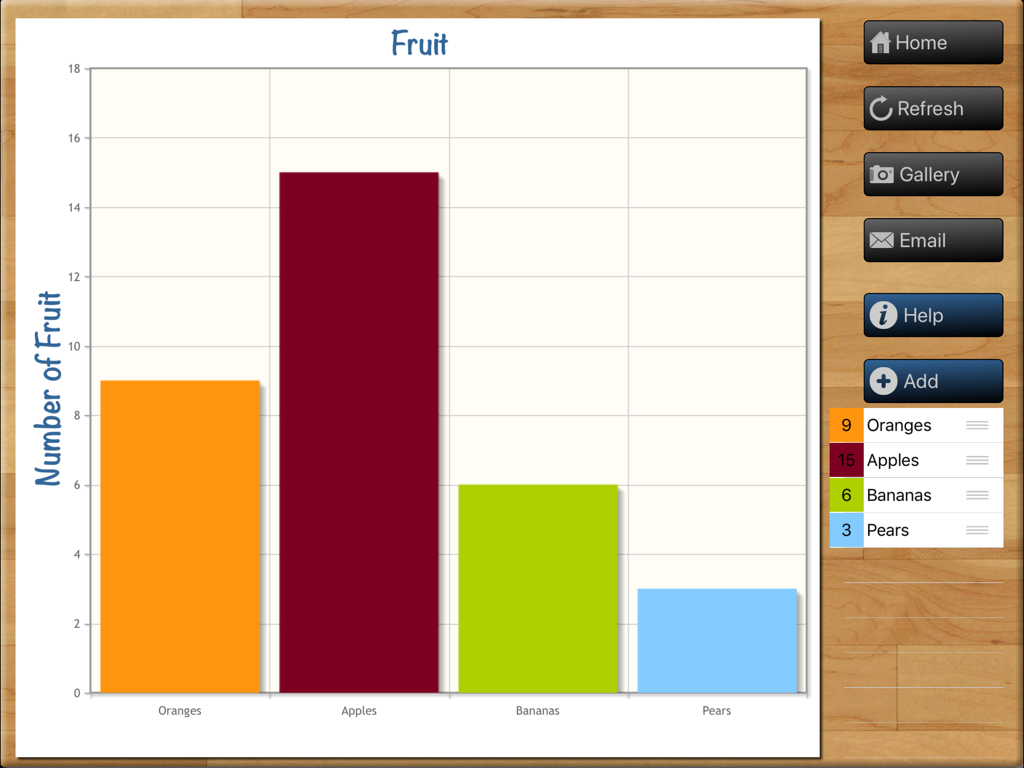
iPad上のTeaching Graphsアプリのインターフェースにあるカラフルな棒グラフ「果物」
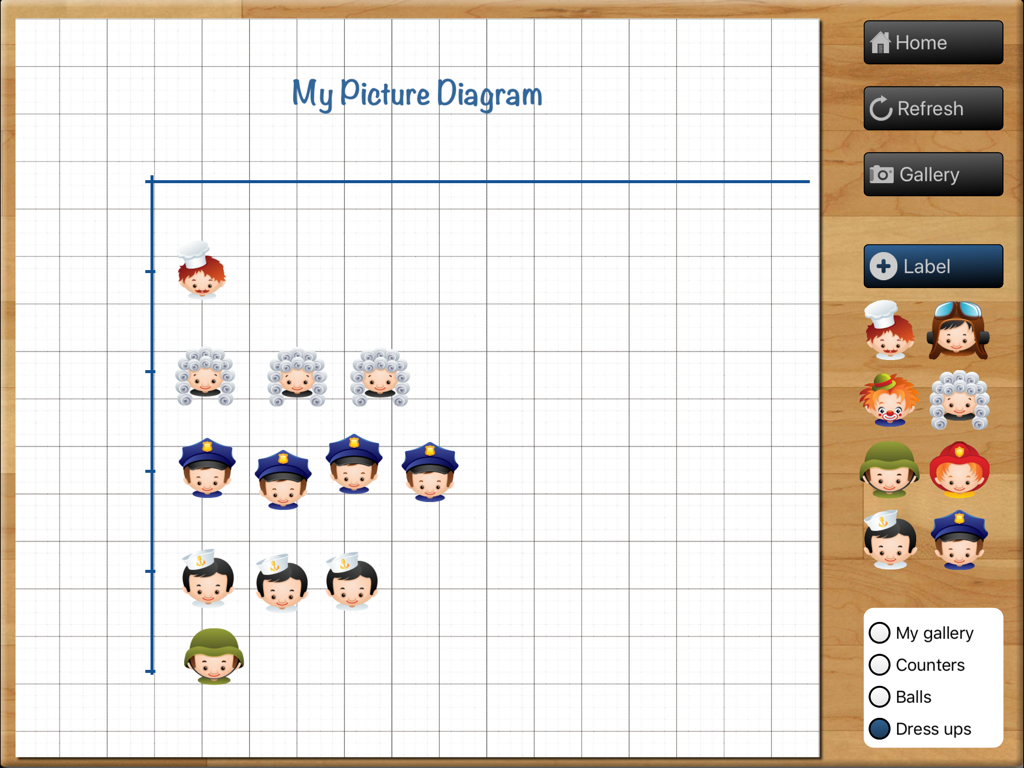
グリッド上のキャラクターアイコンを備えた絵グラフ作成ツールのTeaching Graphsアプリのインターフェース
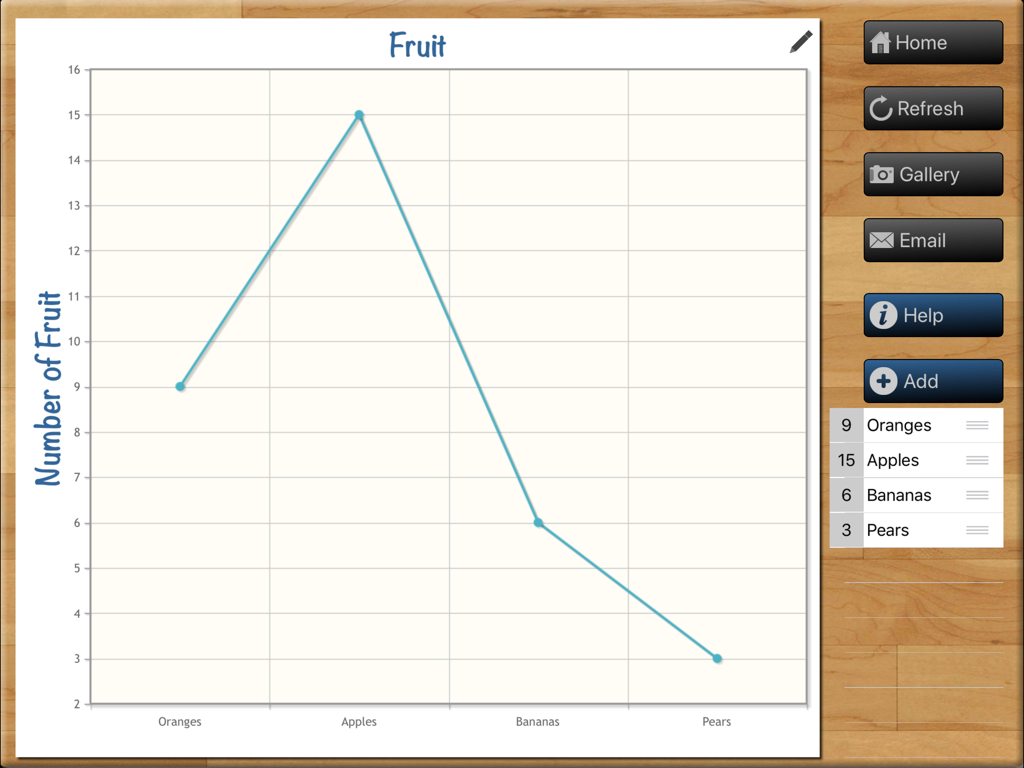
Teaching Graphs iPadアプリのインターフェースにある果物の数を表示する折れ線グラフ
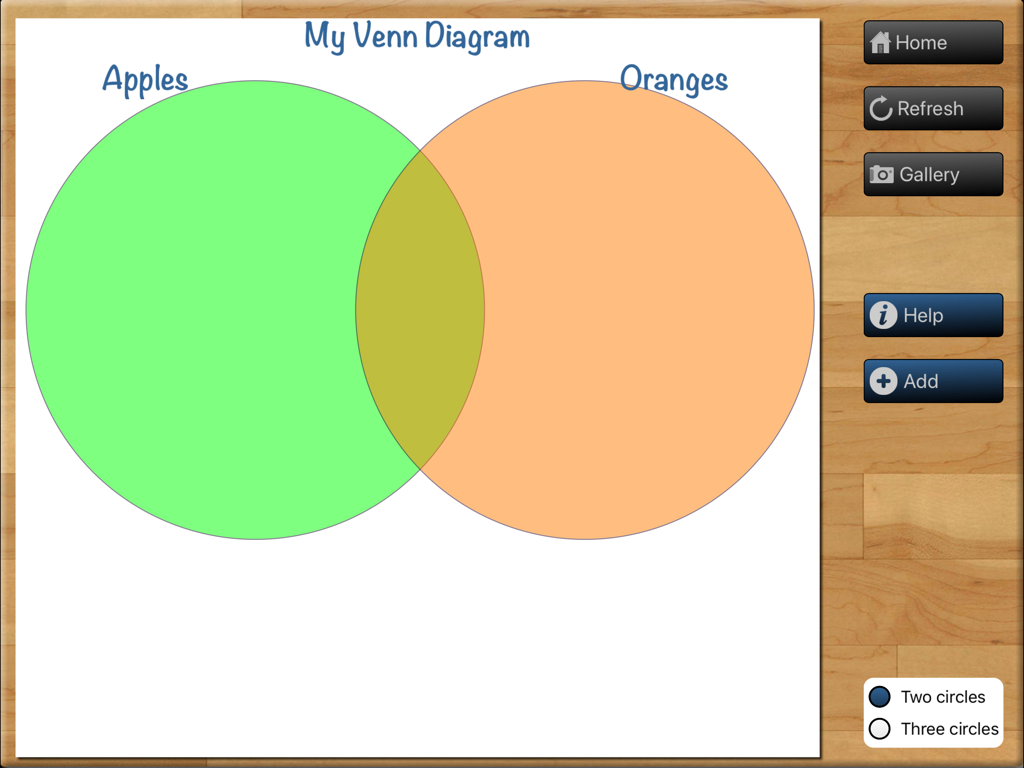
リンゴとオレンジというラベルの2つの重なり合う円を持つベン図を作成するためのTeaching Graphsアプリのインターフェース。
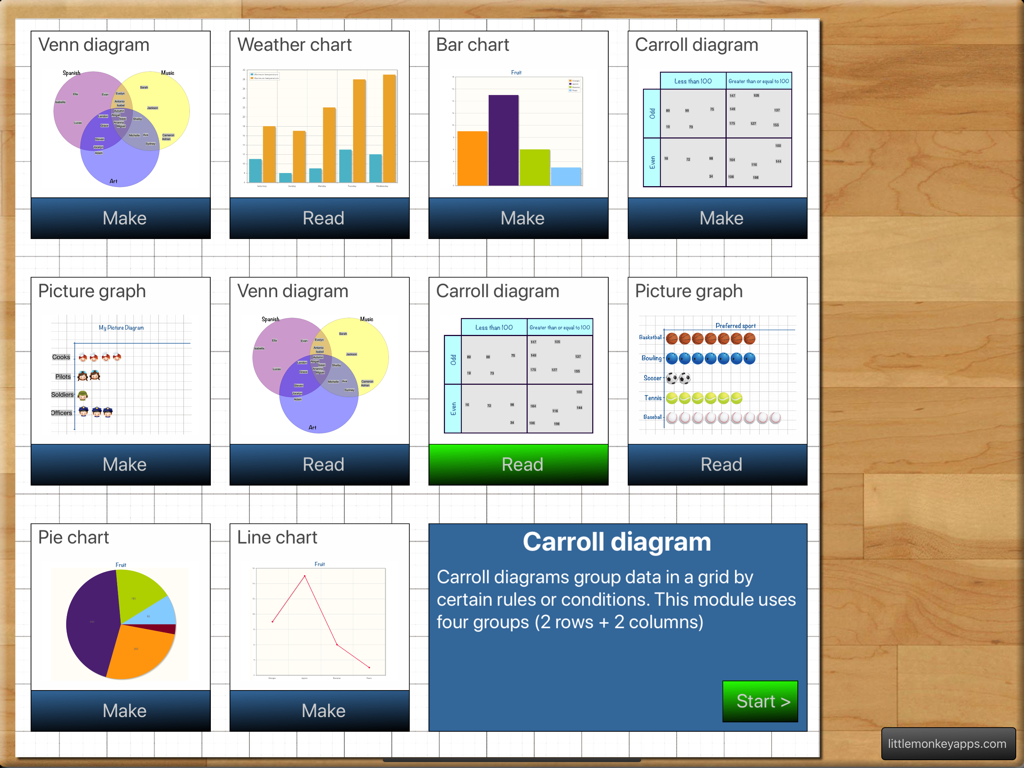
生徒が読み取りまたは作成できるさまざまな種類のグラフや図が表示されるTeaching Graphsアプリのメインメニュー。
説明
Download
類似アプリ
同じカテゴリのトップランクアプリ

Duolingo - Language Lessons
Duolingo, Inc

Speak & Learn English: Learna
DEEP FLOW SOFTWARE SERVICES - FZCO

驾考宝典-科一科四驾驶证考试驾考通
Wuhan Jiakaobaodian Information Service Co., Ltd.

Toca Boca World
Toca Boca AB

Google Classroom
Google LLC

作业帮-中小学家长作业检查和辅导工具
Guangzhou Polar Future Culture Technology Co., Ltd

学信网
Student Information Consultation Service Co., Ltd.

Gauth: AI Study Companion
GAUTHTECH PTE. LTD.

ArtWorkout: Learn How to Draw
Aleksandr Ulitin
このページはアプリまたはその開発者の公式ページではなく、情報提供および論評を目的として作成された独立した編集出版物です。明示的に別段の記載がない限り、アプリおよびその開発者は、MWM、Apple、Google Play、アプリのパブリッシャー、またはアプリの開発者と提携、承認、後援、認可、またはその他の公式的な関係はなく、このページのいかなる内容も、アプリがMWMのサービスを使用して開発されたことを意味するものではありません。すべての商標、ロゴ、スクリーンショット、その他のコンテンツはそれぞれの所有者の財産です。