이 페이지는 앱이나 개발자의 공식 페이지가 아니며, 정보 제공 및 논평을 목적으로 작성된 독립 편집 간행물입니다. 명시적으로 달리 언급되지 않는 한, 해당 앱이나 개발자는 MWM, Apple, Google Play, 앱 퍼블리셔 또는 앱 개발자와 제휴, 보증, 후원, 승인 또는 공식적으로 연결되어 있지 않으며, 이 페이지의 어떤 내용도 해당 앱이 MWM의 서비스를 사용하여 개발되었음을 의미하지 않습니다. 모든 상표, 로고, 스크린샷 및 기타 콘텐츠는 해당 소유자의 자산입니다.

Teaching Graphs
학생들이 자신의 세계를 시각화하도록 힘을 실어주세요. 벤 다이어그램부터 파이 차트까지, Teaching Graphs는 스프레드시트의 복잡성 없이 어린 학습자들에게 데이터 이해를 재미있고 쉽게 만듭니다.
다운로드
87K+사용자 평점
총 평가 수
0개발사
카테고리
Education지원 언어
1최신 버전
1.43크기
18.4 MB출시일
2012년 8월 23일데이터 이해력으로 어린 마음을 키우세요
학생들이 전문 소프트웨어의 복잡성 대신 그래프의 논리에 집중할 수 있는 방해 없는 환경입니다.
손쉬운 그래프 만들기
스프레드시트는 건너뛰세요. 학생들은 직관적인 드래그 앤 드롭 도구를 사용하여 다채로운 벤, 캐럴, 파이 차트를 만듭니다.
실제 데이터 읽기
실시간 날씨 데이터와 어린 학습자에게 적합한 관련성 있는 데이터 세트를 해석하여 비판적 사고 능력을 개발하세요.
다음 스크린샷과 설명은 앱의 공식 스토어 목록에서 직접 가져온 것이며 앱 개발자의 자산입니다.
앱 스토어
스크린샷
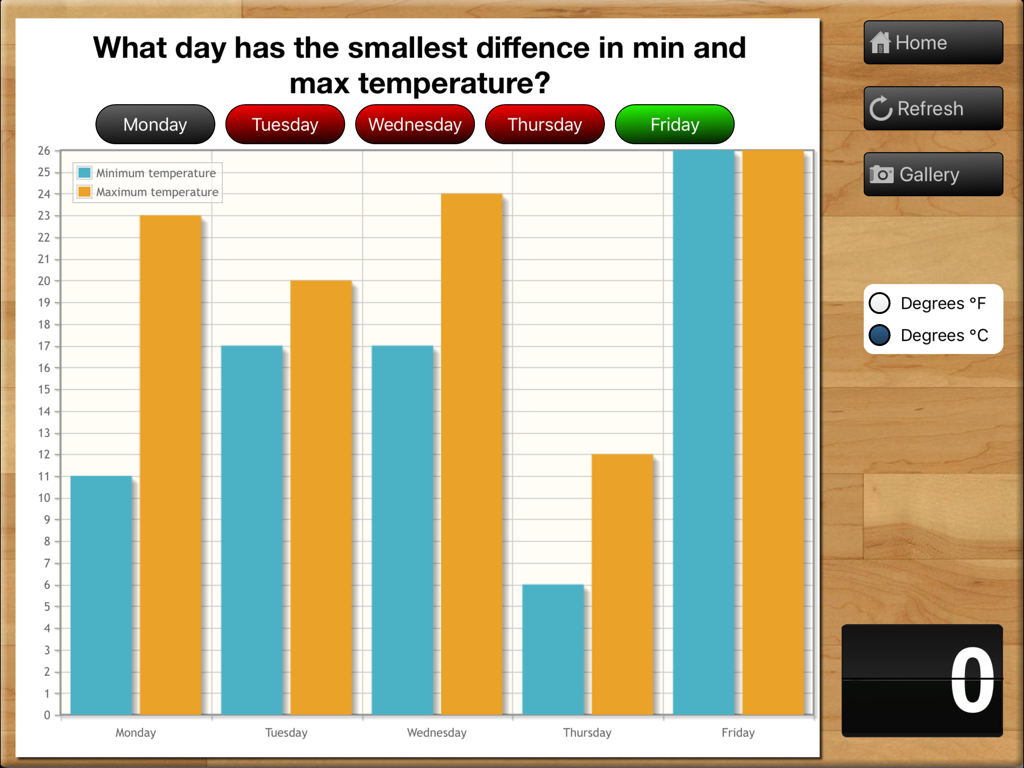
5일간의 학교 주간에 대한 최저 및 최고 기온 비교를 보여주는 교육용 막대 그래프입니다.
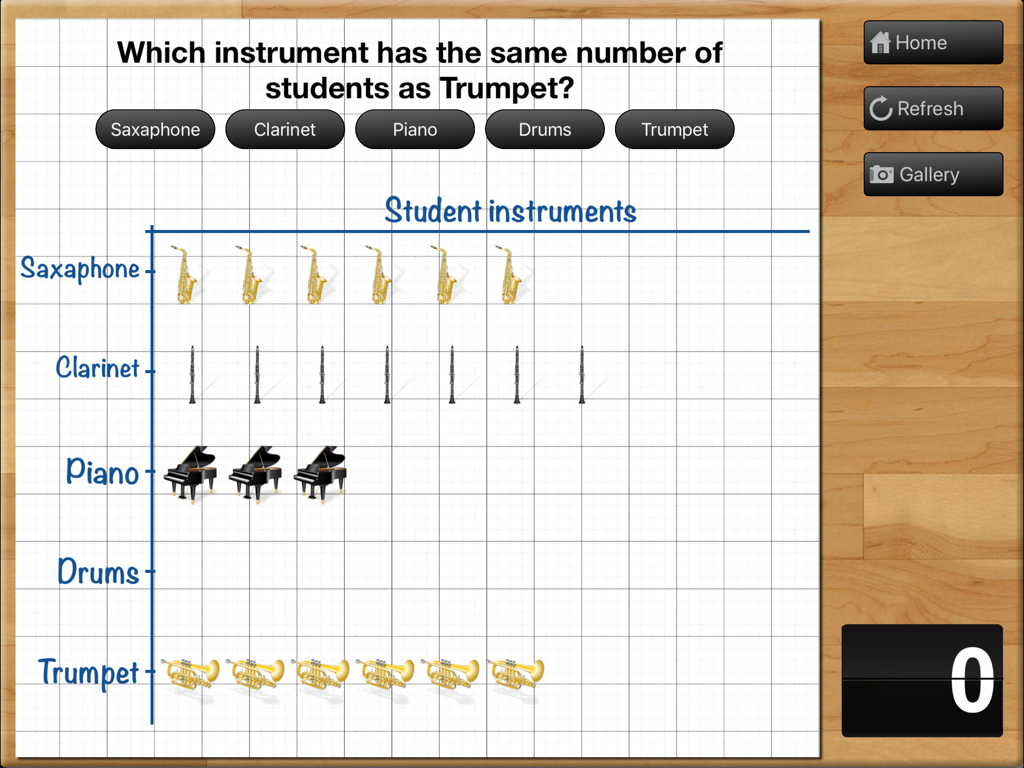
Teaching Graphs iPad 앱 내 그리드에 학생 악기 데이터를 보여주는 그림 그래프입니다.
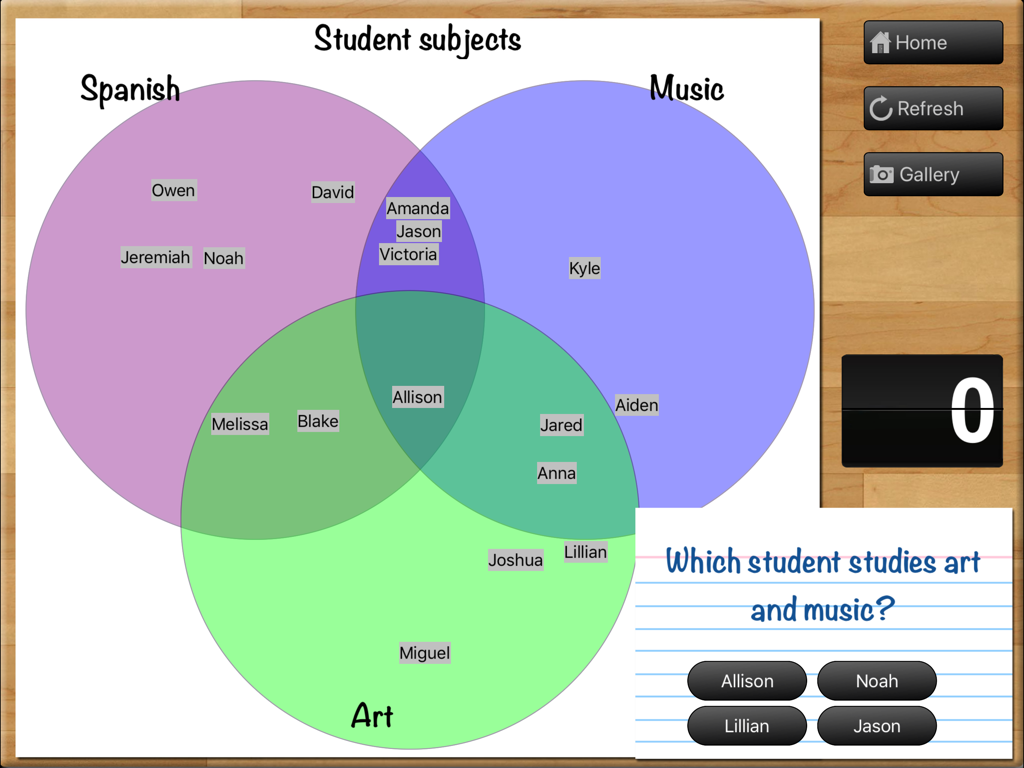
스페인어, 음악, 미술의 중복 카테고리에 대한 학생 퀴즈에 사용되는 Teaching Graphs 앱의 3개 원 벤 다이어그램입니다.
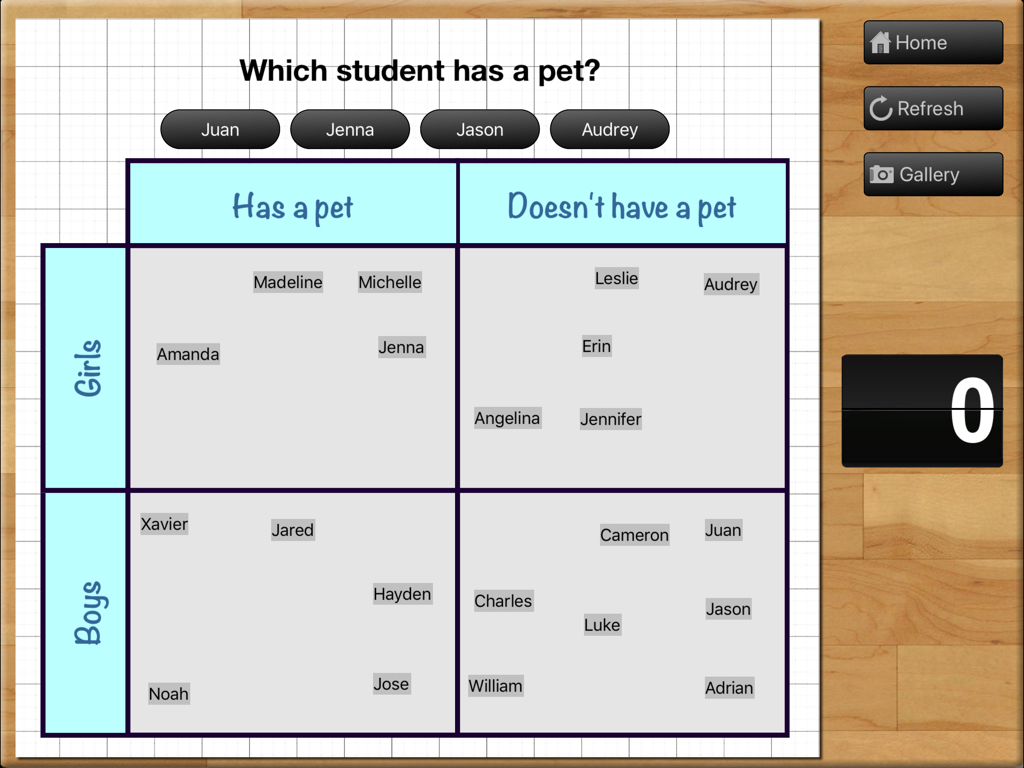
반려동물 소유 여부에 따라 소년과 소녀를 분류하는 그리드를 보여주는 Teaching Graphs 앱의 캐럴 다이어그램 활동입니다.
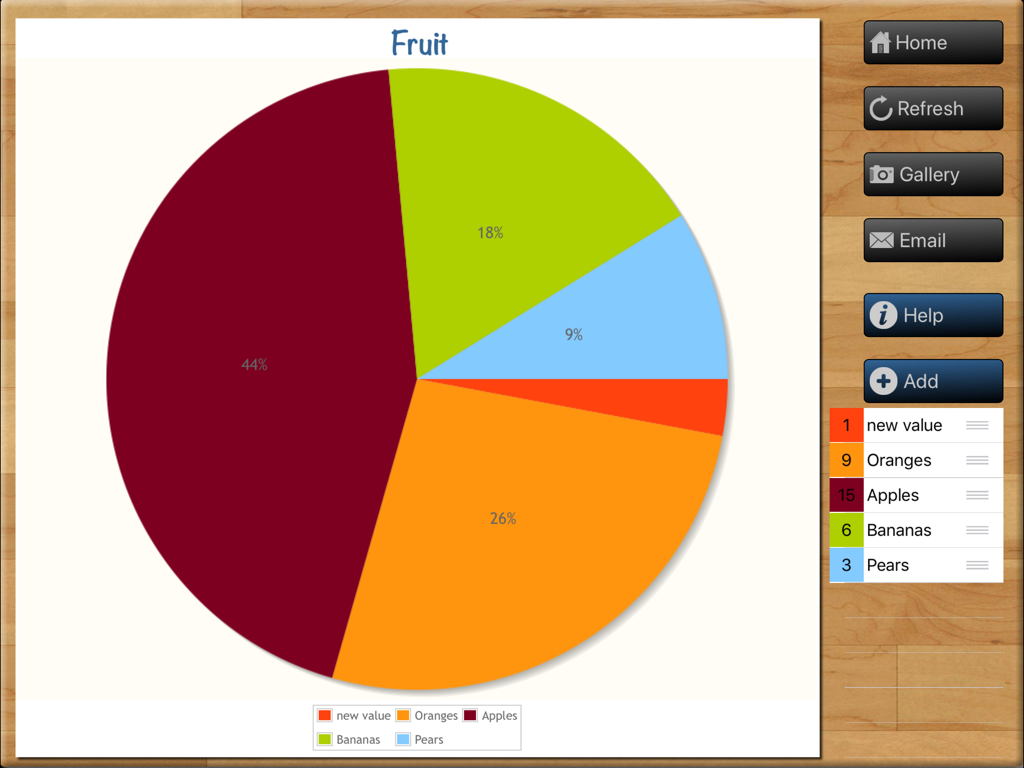
Teaching Graphs 교육용 iPad 앱에서 사과, 오렌지, 바나나 데이터를 보여주는 과일 테마 파이 차트가 만들어지고 있습니다.
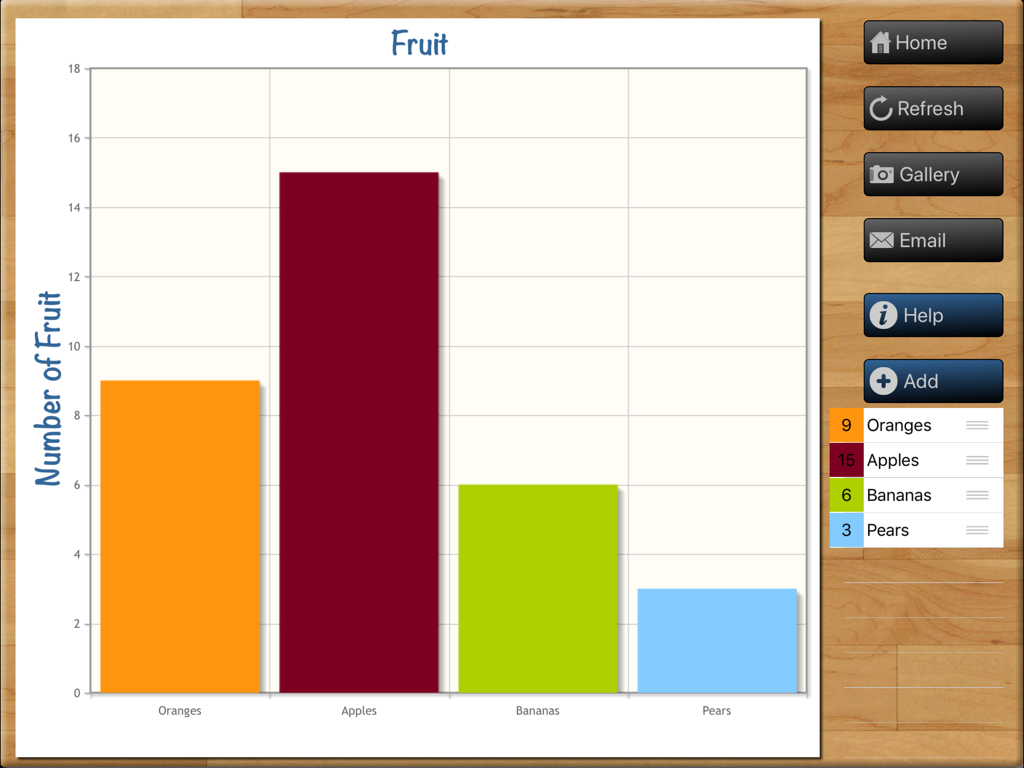
iPad의 Teaching Graphs 앱 인터페이스에서 '과일'이라는 제목의 다채로운 막대 그래프입니다.
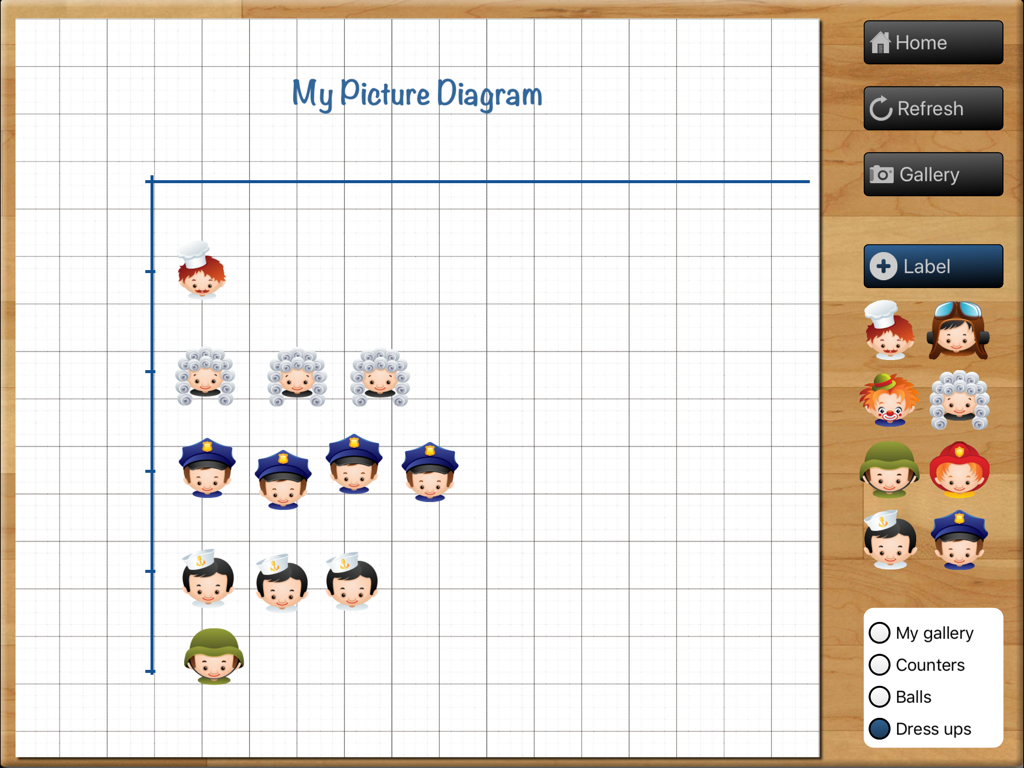
그리드에 캐릭터 아이콘이 있는 그림 다이어그램 작성기를 보여주는 Teaching Graphs 앱의 인터페이스입니다.
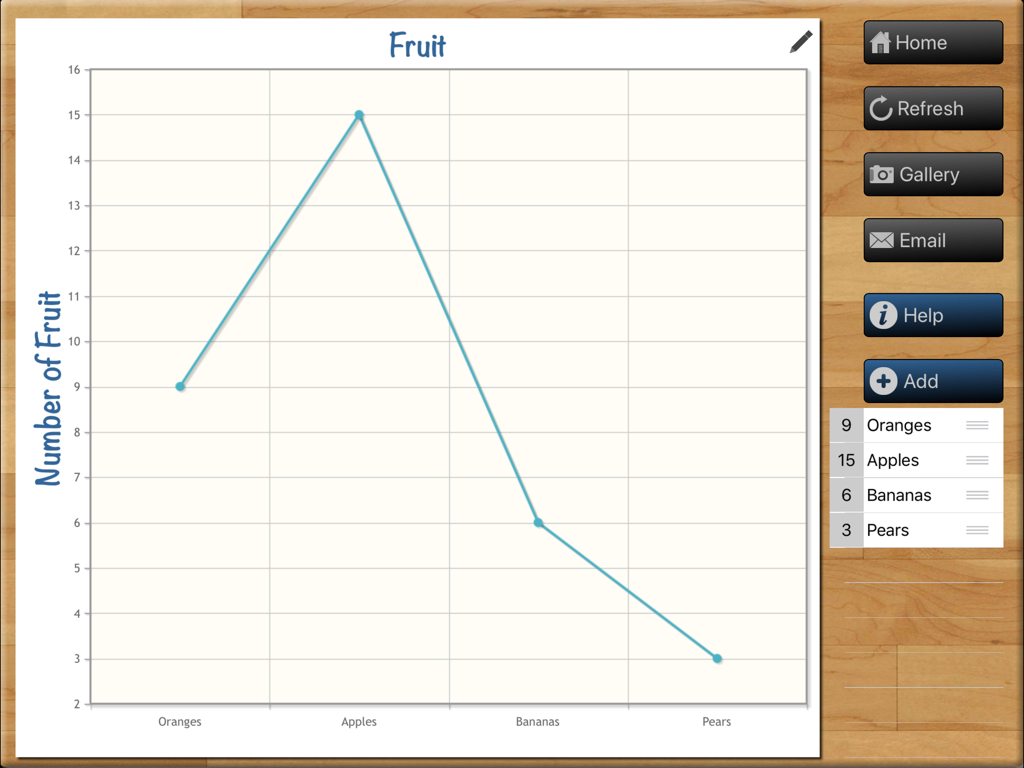
Teaching Graphs iPad 앱 인터페이스에서 과일 개수를 보여주는 꺾은선 그래프입니다.
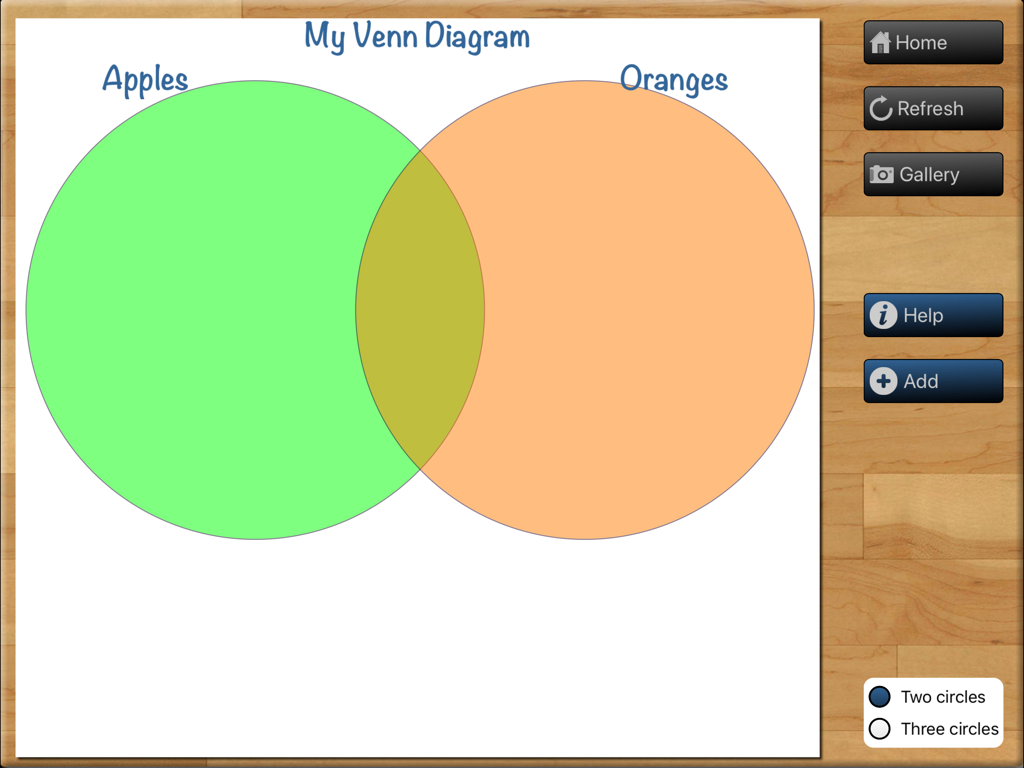
사과와 오렌지라는 레이블이 붙은 두 개의 겹치는 원을 사용하여 벤 다이어그램을 만드는 Teaching Graphs 앱 인터페이스입니다.
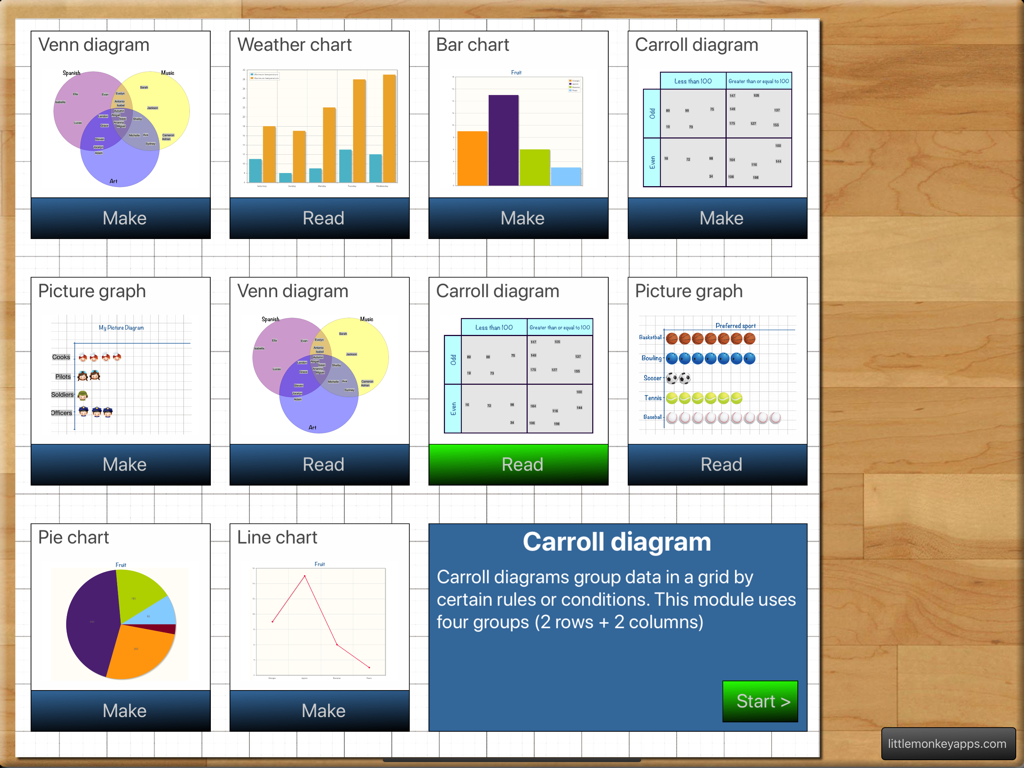
학생들이 읽거나 만들 수 있는 다양한 유형의 차트와 다이어그램이 포함된 Teaching Graphs 앱의 메인 메뉴입니다.
설명
Download
비슷한 앱
같은 카테고리의 상위 앱

Duolingo - Language Lessons
Duolingo, Inc

Speak & Learn English: Learna
DEEP FLOW SOFTWARE SERVICES - FZCO

驾考宝典-科一科四驾驶证考试驾考通
Wuhan Jiakaobaodian Information Service Co., Ltd.

Toca Boca World
Toca Boca AB

Google Classroom
Google LLC

作业帮-中小学家长作业检查和辅导工具
Guangzhou Polar Future Culture Technology Co., Ltd

学信网
Student Information Consultation Service Co., Ltd.

Gauth: AI Study Companion
GAUTHTECH PTE. LTD.

ArtWorkout: Learn How to Draw
Aleksandr Ulitin
이 페이지는 앱이나 개발자의 공식 페이지가 아니며, 정보 제공 및 논평을 목적으로 작성된 독립 편집 간행물입니다. 명시적으로 달리 언급되지 않는 한, 해당 앱이나 개발자는 MWM, Apple, Google Play, 앱 퍼블리셔 또는 앱 개발자와 제휴, 보증, 후원, 승인 또는 공식적으로 연결되어 있지 않으며, 이 페이지의 어떤 내용도 해당 앱이 MWM의 서비스를 사용하여 개발되었음을 의미하지 않습니다. 모든 상표, 로고, 스크린샷 및 기타 콘텐츠는 해당 소유자의 자산입니다.