This page is not an official page of the app or its developer, but an independent editorial publication created for informational and commentary purposes. Unless expressly stated otherwise, neither the app nor its developer is affiliated with, endorsed by, sponsored by, authorized by, or otherwise officially connected with MWM, Apple, Google Play, the app publisher, or the app's developer, and nothing on this page implies that the app was developed using MWM's services. Any trademarks, logos, screenshots, and other content remain the property of their respective owners.

Hands-On Math Graph Cubes
Transform abstract math into a visual playground. Engage K-4 students with intelligent feedback as they build, analyze, and explore bar graphs—perfectly designed for the iPad classroom and independent discovery.
Downloads
0User Rating
Total Ratings
0Publisher
Category
EducationLocales
1Latest Version
5.0.1Size
18.4 MBFirst Released
Aug 28, 2012Transform Data Into Discovery
Empower young learners to master data literacy through interactive virtual cubes, intelligent scaffolding, and open-ended exploration designed for the modern classroom.
Interactive Virtual Manipulatives
Replace physical clutter with intuitive digital cubes that help students visualize logical relationships through tactile drag-and-drop play without the mess.
Intelligent Real-Time Feedback
Foster independent study with AI-powered guidance that provides immediate behavioral reinforcement, allowing students to self-correct and build confidence.
The following screenshots and description are sourced directly from the app's official store listing and are the property of the app developer.
App Store
Screenshots
The home screen of the Hands-On Math Graph Cubes app showing a wooden background and a bar graph made of colored cubes.
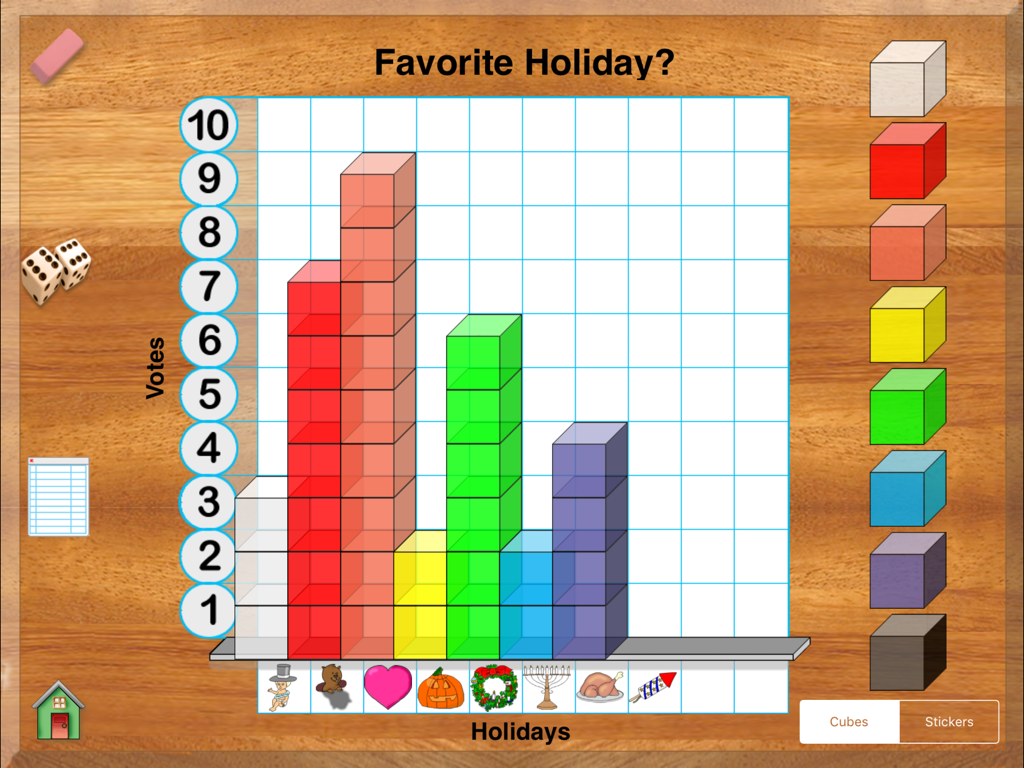
A virtual bar graph titled Favorite Holiday created with colorful cubes in an educational math app
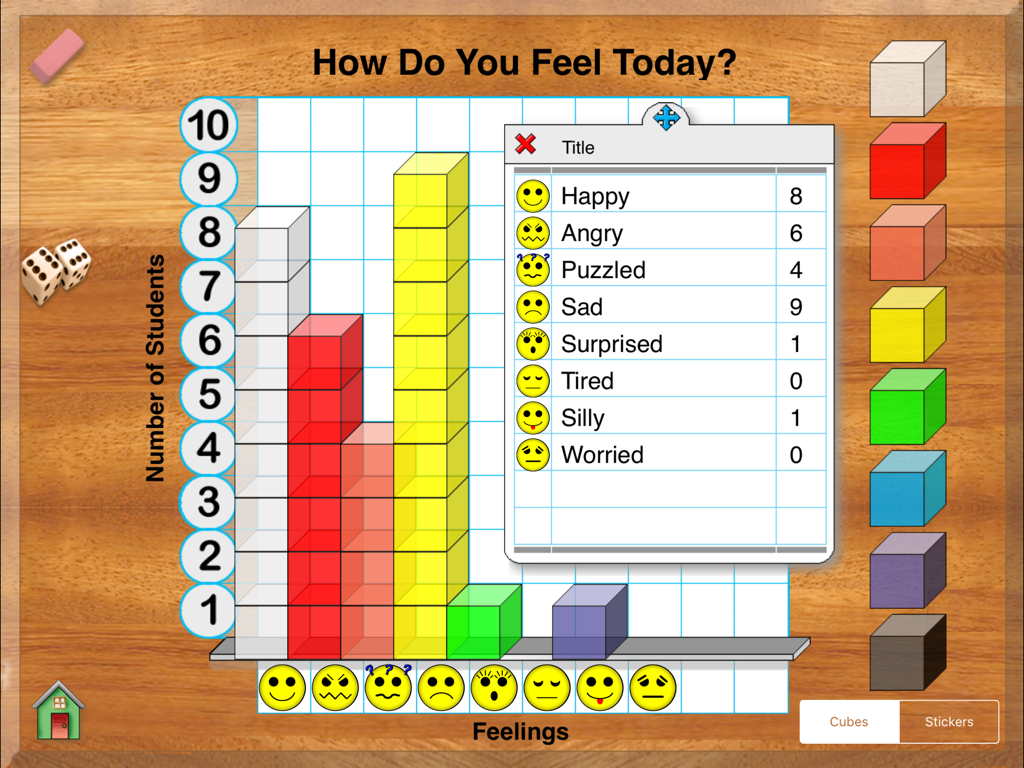
A digital bar graph titled How Do You Feel Today using colored cubes to represent student emotions
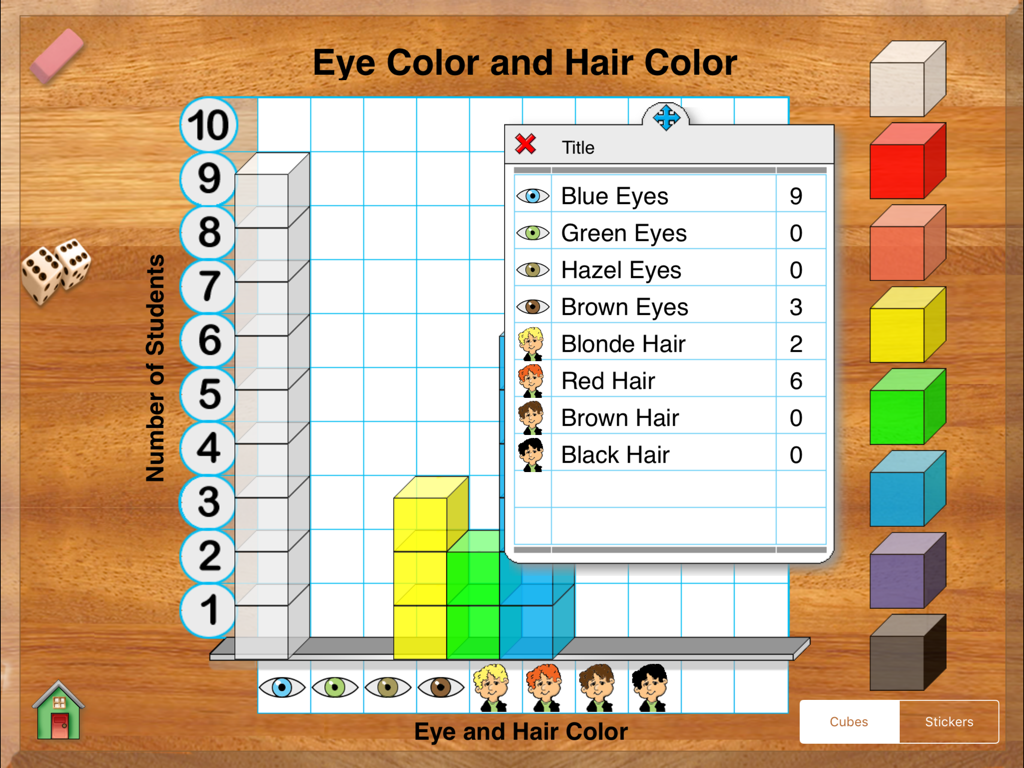
An educational iPad app screen showing a bar graph being built with colored cubes and a corresponding data table.
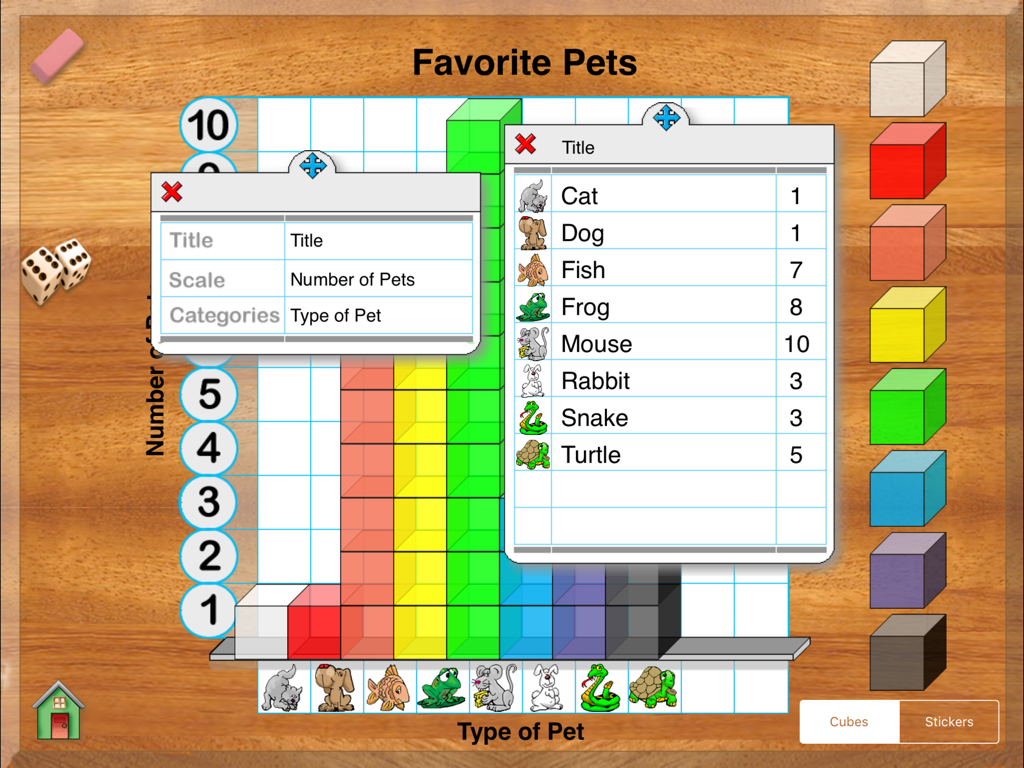
A colorful bar graph showing favorite pets data using 3D virtual cubes
Description
Download
More Like This
Top-ranked apps in the same category

Duolingo: Language & Chess
Duolingo, Inc

Speak & Learn English: Learna
DEEP FLOW SOFTWARE SERVICES - FZCO

驾考宝典-科一科四驾驶证考试驾考通
Wuhan Jiakaobaodian Information Service Co., Ltd.

Toca Boca World
Toca Boca AB

学信网
Student Information Consultation Service Co., Ltd.

Google Classroom
Google LLC

作业帮-中小学家长作业检查和辅导工具
Guangzhou Polar Future Culture Technology Co., Ltd

驾校一点通-2025驾校学车考驾照
Tianjin 58 driver Information Technology Co. Ltd.

学习通
Beijing Chaoxing Digital Library Information Technology Co., Ltd.
This page is not an official page of the app or its developer, but an independent editorial publication created for informational and commentary purposes. Unless expressly stated otherwise, neither the app nor its developer is affiliated with, endorsed by, sponsored by, authorized by, or otherwise officially connected with MWM, Apple, Google Play, the app publisher, or the app's developer, and nothing on this page implies that the app was developed using MWM's services. Any trademarks, logos, screenshots, and other content remain the property of their respective owners.