This page is not an official page of the app or its developer, but an independent editorial publication created for informational and commentary purposes. Unless expressly stated otherwise, neither the app nor its developer is affiliated with, endorsed by, sponsored by, authorized by, or otherwise officially connected with MWM, Apple, Google Play, the app publisher, or the app's developer, and nothing on this page implies that the app was developed using MWM's services. Any trademarks, logos, screenshots, and other content remain the property of their respective owners.

Stock+: Stock Market Heat Map
Stop scrolling through endless tickers. Identify market leaders instantly with interactive treemaps, professional technical indicators, and deep-dive sector analysis designed for the data-driven investor.
Downloads
2K+User Rating
Total Ratings
100Publisher
Category
FinanceLocales
3Latest Version
3.10.0Size
21.2 MBFirst Released
Jan 15, 2024Master the Market at a Glance
Stop scrolling through endless ticker lists. Use interactive heat maps and professional technical indicators to visualize trends and make informed decisions in seconds.
Interactive Market Heat Maps
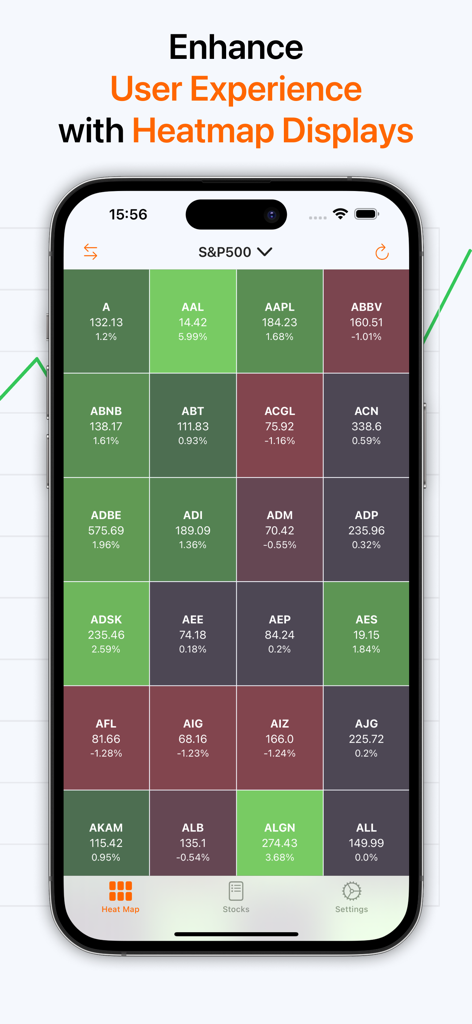
Instantly grasp market sentiment. Visualize the S&P 500, Nasdaq, and Dow Jones through color-coded treemaps scaled by market cap.
Sector Rotation Insights
Deep-dive into specific sectors and industries to identify leaders and laggards. Understand where the money is flowing in real-time.
The following screenshots and description are sourced directly from the app's official store listing and are the property of the app developer.
App Store
Screenshots
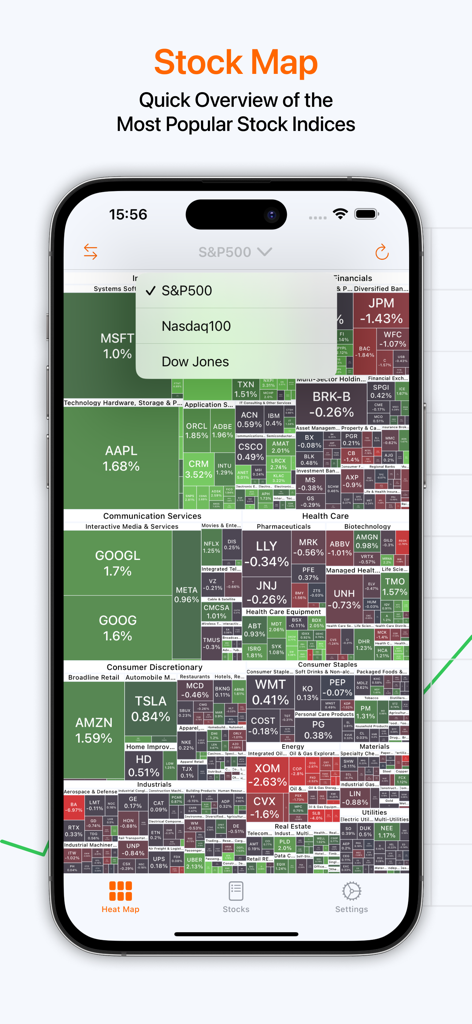
Interactive heat map of the S&P 500 index showing stock performance by sector on a mobile app.
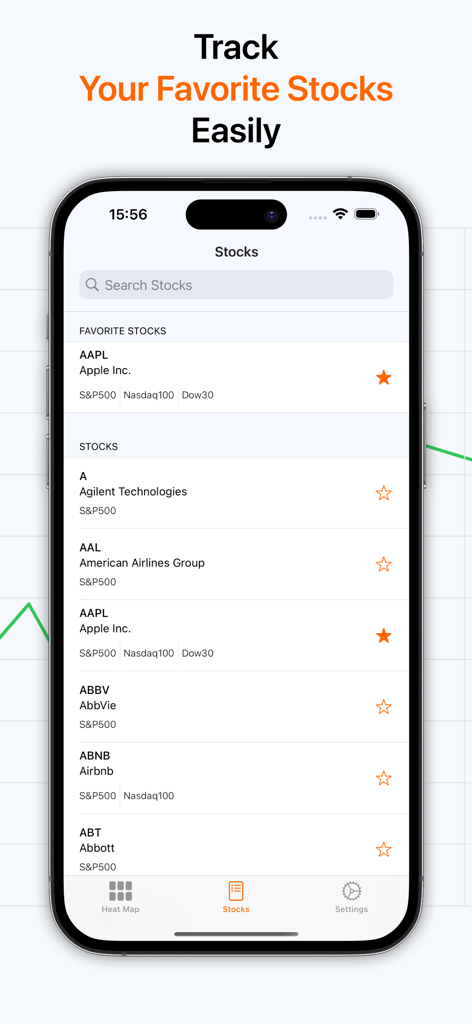
Mobile app interface showing a list of favorite stocks and a search bar for tracking market performance.
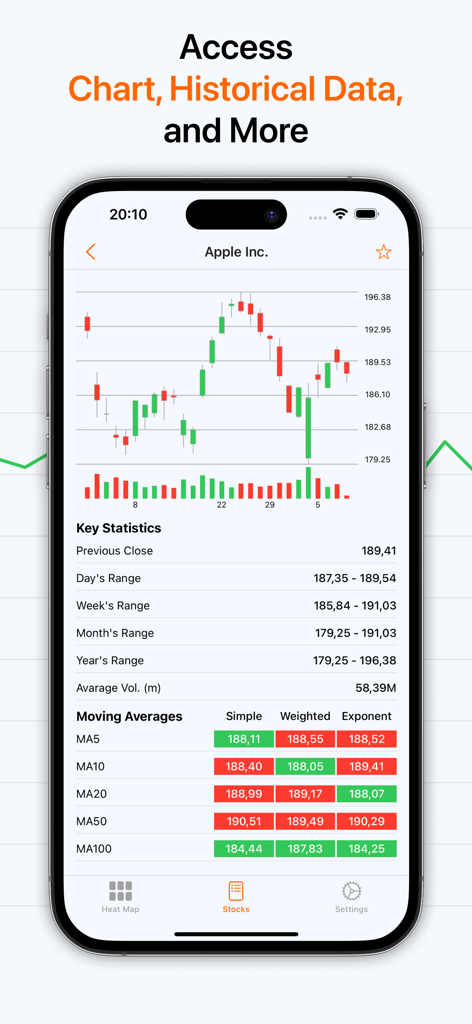
Detailed stock technical analysis screen showing candlestick chart and moving averages table
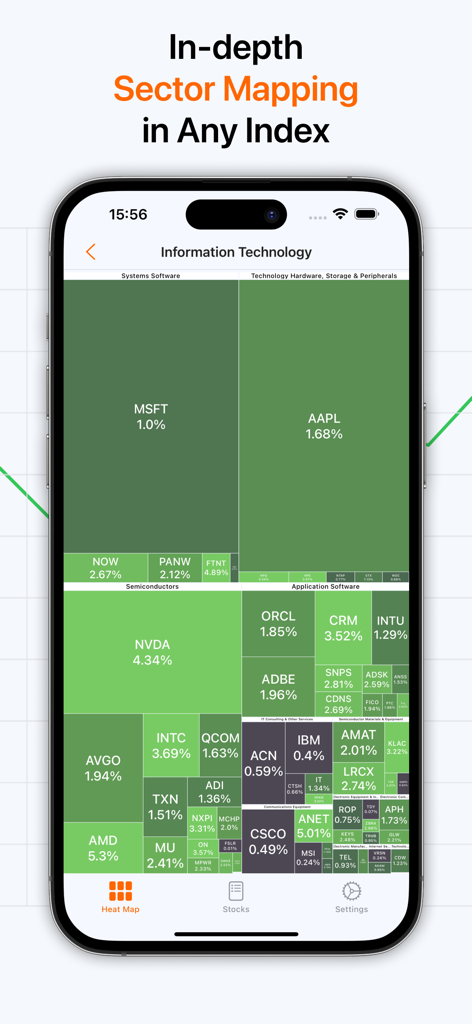
A mobile app screenshot displaying an interactive heat map for Information Technology stocks
A mobile app interface displaying a color-coded stock market heatmap for the S&P 500.
Description
Download
More Like This
Top-ranked apps in the same category

电子税务局
State Administration of Taxation

UnionPay APP
China Unionpay Co.,Ltd.

养基宝 - 年轻人的养基神器
Shenzhen Xiaoduotou Information Technology Co.,Ltd.

PayPal - Pay, Send, Save
PayPal, Inc.

中国农业银行
AGRICULTURAL BANK OF CHINA LIMITED

Mercado Pago: cuenta digital
MercadoLibre S.A.

Kalshi: Trade on the Big Game
KALSHI INC.

中国工商银行
Industrial and Commercial Bank of China

个人所得税
State Administration of Taxation
This page is not an official page of the app or its developer, but an independent editorial publication created for informational and commentary purposes. Unless expressly stated otherwise, neither the app nor its developer is affiliated with, endorsed by, sponsored by, authorized by, or otherwise officially connected with MWM, Apple, Google Play, the app publisher, or the app's developer, and nothing on this page implies that the app was developed using MWM's services. Any trademarks, logos, screenshots, and other content remain the property of their respective owners.