This page is not an official page of the app or its developer, but an independent editorial publication created for informational and commentary purposes. Unless expressly stated otherwise, neither the app nor its developer is affiliated with, endorsed by, sponsored by, authorized by, or otherwise officially connected with MWM, Apple, Google Play, the app publisher, or the app's developer, and nothing on this page implies that the app was developed using MWM's services. Any trademarks, logos, screenshots, and other content remain the property of their respective owners.

Vernier Graphical Analysis
Empowering students and educators to wirelessly capture, visualize, and analyze experimental data in real-time. Transform your lab results into professional-grade reports with industry-leading graphing tools and seamless sensor integration.
Downloads
318K+User Rating
Total Ratings
500Publisher
Category
EducationLocales
32Latest Version
6.2.2Size
58.3 MBFirst Released
Aug 11, 2018Master Your Science Labs with Ease
From real-time sensor data collection to advanced statistical analysis, Graphical Analysis provides the professional tools needed to excel in STEM education.
Wireless Data Collection
Connect instantly to Go Direct sensors via Bluetooth to track experiments without the clutter of tangled wires.
Advanced Analysis Tools
Perform complex curve fits, view instantaneous rates of change, and calculate statistics with just a few taps.
The following screenshots and description are sourced directly from the app's official store listing and are the property of the app developer.
App Store
Screenshots
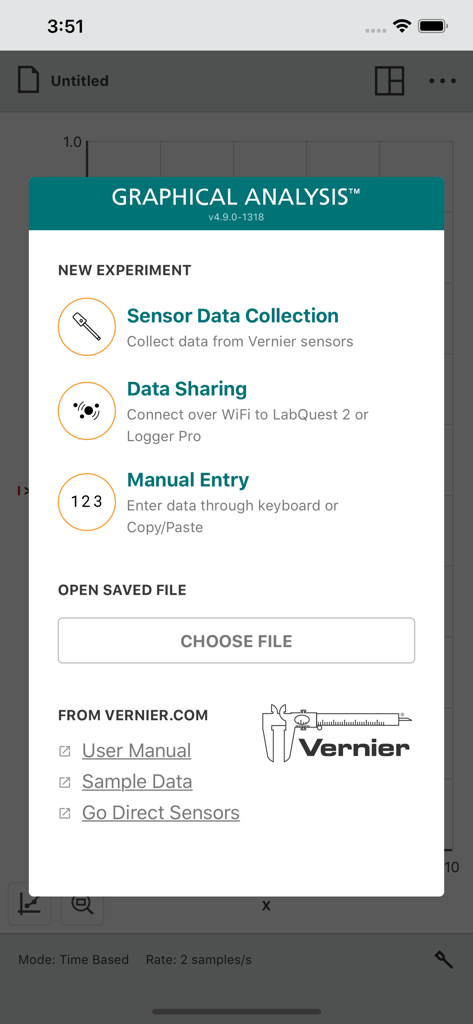
New experiment selection menu in the Vernier Graphical Analysis app showing data collection and sharing options.
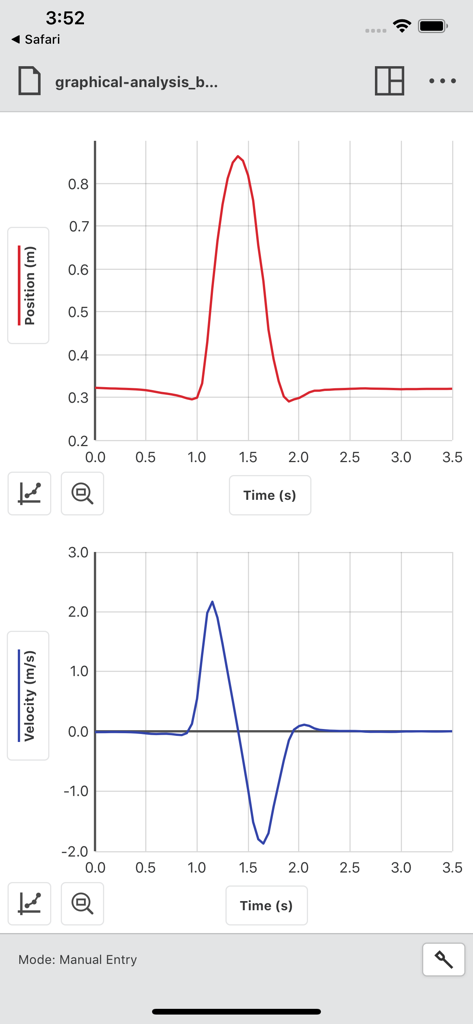
Position and velocity versus time graphs displayed in the Vernier Graphical Analysis app interface
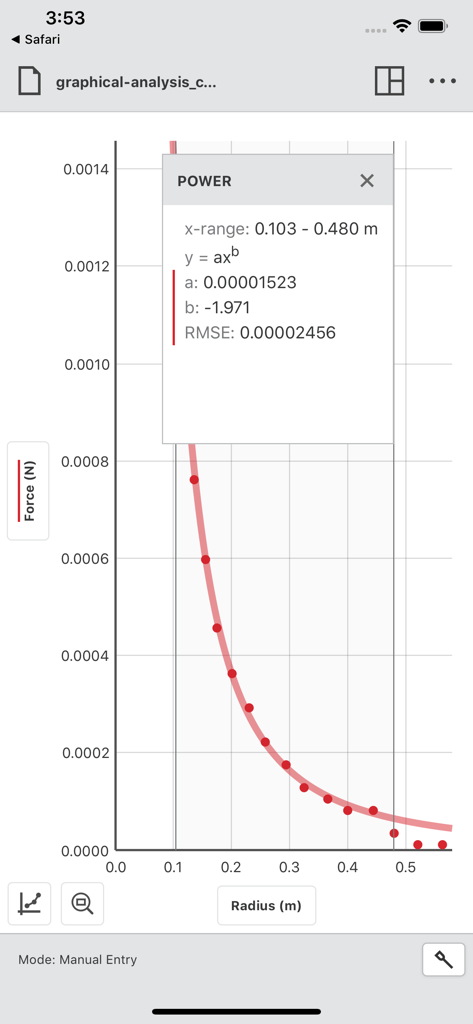
A graph of force versus radius showing a power curve fit and statistical analysis in the Vernier Graphical Analysis app
Description
Download
More Like This
Apps with similar features and user experience

My Jump Lab (My Jump 3)
Carlos Balsalobre

PitchLab - Baseball
PitchLab AI, Inc.

My Jump 2
Carlos Balsalobre

Photo Finish: Automatic Timing
Voigt, Plewnia & Leite Photo Finish GbR

Mustard: Pitching
QualiaOS, Incorporated

FizziQ
Christophe Chazot

SprintTimer - Photo Finish
Sten Kaiser

Video Delay Instant Replay
michal bojanowicz

phyphox
RWTH Aachen University
This page is not an official page of the app or its developer, but an independent editorial publication created for informational and commentary purposes. Unless expressly stated otherwise, neither the app nor its developer is affiliated with, endorsed by, sponsored by, authorized by, or otherwise officially connected with MWM, Apple, Google Play, the app publisher, or the app's developer, and nothing on this page implies that the app was developed using MWM's services. Any trademarks, logos, screenshots, and other content remain the property of their respective owners.