このページはアプリまたはその開発者の公式ページではなく、情報提供および論評を目的として作成された独立した編集出版物です。明示的に別段の記載がない限り、アプリおよびその開発者は、MWM、Apple、Google Play、アプリのパブリッシャー、またはアプリの開発者と提携、承認、後援、認可、またはその他の公式的な関係はなく、このページのいかなる内容も、アプリがMWMのサービスを使用して開発されたことを意味するものではありません。すべての商標、ロゴ、スクリーンショット、その他のコンテンツはそれぞれの所有者の財産です。

Desmos Graphing Calculator
数学の壁を打ち破り、方程式の裏に隠された真実を解き放つ。このアプリは、ユーザーに抽象的な概念を視覚化し、複雑なデータを瞬時に解析する能力を与える。
ダウンロード
7.5M+ユーザー評価
評価数
5.2K開発元
カテゴリ
Education対応言語
18最新バージョン
7.48.0サイズ
17.5 MBリリース日
2013年6月18日高度な数学的可視化と解析のためのツール
「Desmos Graphing Calculator」の主要機能分析
高度なグラフ描画
このアプリは、極座標、デカルト座標、パラメトリックグラフなど、多様な形式の数式を無制限に同時に描画する機能を提供し、ユーザーは複雑な関係性を視覚的に探求できます。
スライダー機能
本ツールは、スライダーを用いて数式のパラメーターを対話的に調整する機能を提供し、ユーザーはグラフへの影響を直感的に理解し、動的に可視化できます。
特徴点の自動検出
ユーザーは曲線をタッチするだけで、最大値、最小値、交点などの重要な特徴点を自動的に表示させることができ、これらの点の座標も確認可能です。
高機能な科学計算
このツールは、平方根、対数、絶対値などを含む任意の数式を入力するだけで、瞬時に解答を表示する科学計算機能を提供し、ユーザーは複雑な計算を容易に実行できます。
統計分析機能
本アプリは、与えられたデータセットに対して、最適な回帰直線や放物線などを自動的に導き出す統計分析機能を提供し、ユーザーはデータモデリングを効率的に行えます。
データテーブルとプロット
ユーザーはデータを入力してプロットしたり、任意の関数に対する入出力テーブルを作成したりすることが可能で、これによりデータの整理と可視化が容易になります。
不等式の描画
この機能により、ユーザーはデカルト座標系および極座標系における不等式を視覚的に描画し、解領域を直感的に把握することが可能です。
アクセシビリティ機能
このアプリは、スクリーンリーダーや点字ディスプレイでの数式読み取り・編集、音声トレースによるグラフ・データの探求など、多様なアクセシビリティオプションを提供し、幅広いユーザーが利用できます。
直感的なズームと表示範囲調整
ユーザーは2本の指でのピンチ操作や手動入力により、軸を独立して、または同時にスケーリングし、グラフの表示範囲を完璧に調整することが可能です。
オフラインでの利用
本アプリはインターネット接続が不要であり、ユーザーはいつでもどこでも計算機機能やグラフ描画機能を利用できます。
よくある質問
について知っておくべきこと Desmos Graphing Calculator
Is the Desmos Graphing Calculator app free to use?
Yes, the Desmos Graphing Calculator app is completely free to use. Users can access all its powerful graphing features, including plotting equations, adding sliders, and creating tables, without any cost.
What types of graphs can the Desmos Graphing Calculator plot?
The Desmos Graphing Calculator plots polar, Cartesian, and parametric graphs. It supports plotting any equation, such as lines, parabolas, derivatives, and Fourier series, without requiring expressions in y= form.
Can I use sliders in the Desmos Graphing Calculator app?
Yes, the Desmos Graphing Calculator app allows users to add sliders. These sliders enable interactive adjustment of values to build intuition or animate parameters to visualize their effect on a graph.
Does Desmos Graphing Calculator work offline?
Yes, the Desmos Graphing Calculator app functions completely offline. Users do not need internet access to plot equations, add sliders, create tables, or utilize other graphing features.
How does Desmos Graphing Calculator handle data input and plotting?
The Desmos Graphing Calculator allows users to input and plot data by creating tables. Users can also generate an input-output table for any function or build a scatterplot directly from data.
Can Desmos Graphing Calculator help find points of interest on a graph?
Yes, the Desmos Graphing Calculator identifies points of interest. Users can touch a curve to display maximums, minimums, and points of intersection, and tap gray points to view their coordinates.
Is the Desmos Graphing Calculator accessible for users with disabilities?
Yes, Desmos Graphing Calculator includes accessibility features. It supports reading and editing math using a screen reader or refreshable Braille display, and offers audio trace to explore graphs via sound.
Can I save and open Desmos Graphing Calculator graphs on multiple devices?
Yes, users can open their Desmos Graphing Calculator graphs anywhere. By signing in, users can explore example graphs or access their saved masterpieces on any compatible device.
Does the Desmos Graphing Calculator app include a scientific calculator?
Yes, the Desmos Graphing Calculator features an integrated scientific calculator. Users can type in any equation to solve it, with support for functions like square roots, logs, and absolute value.
以下のスクリーンショットと説明は、アプリの公式ストアリスティングから直接取得されたものであり、アプリ開発者の所有物です。
アプリストア
スクリーンショット
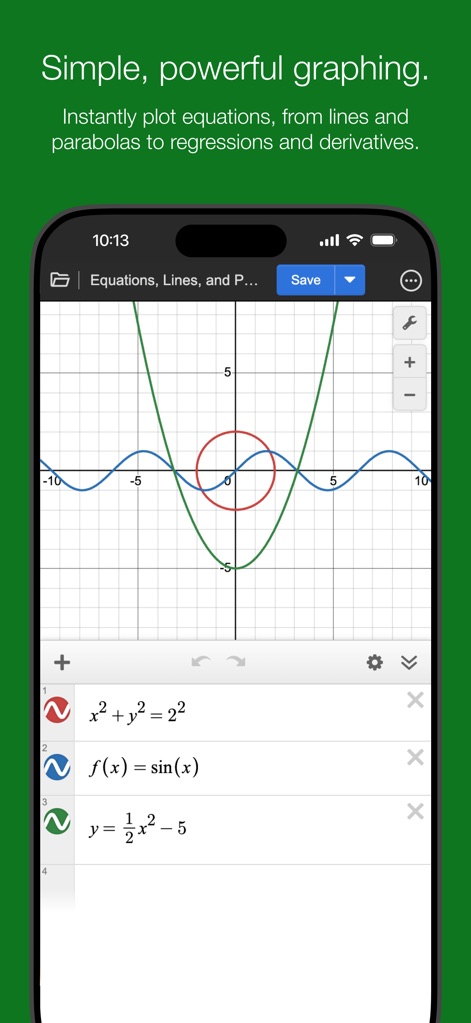
複数の関数(放物線、サイン波)を同時にプロットし、それぞれの曲線とそれらの交点を明瞭に表示します。
多様なグラフ描画
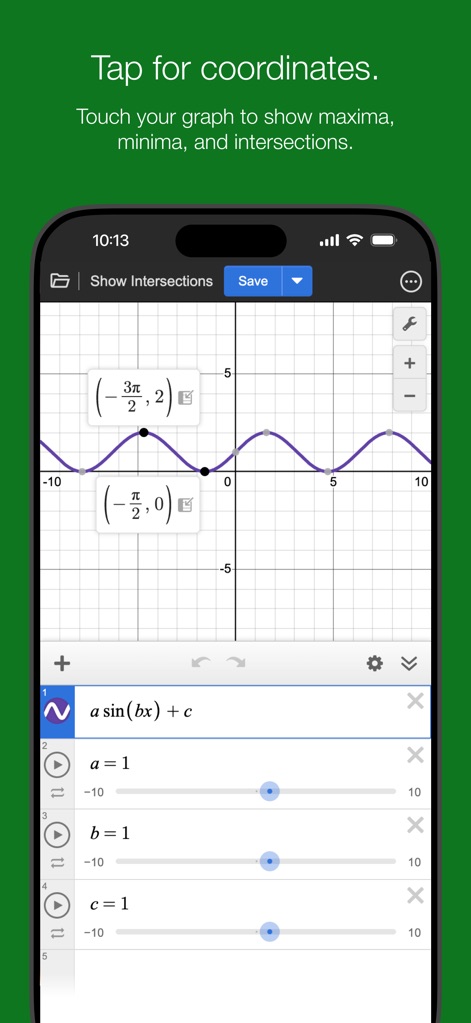
グラフ上の極大値や極小値、交点に触れることで正確な座標値を表示し、重要な点の特定が容易になります。
グラフ探索を深める
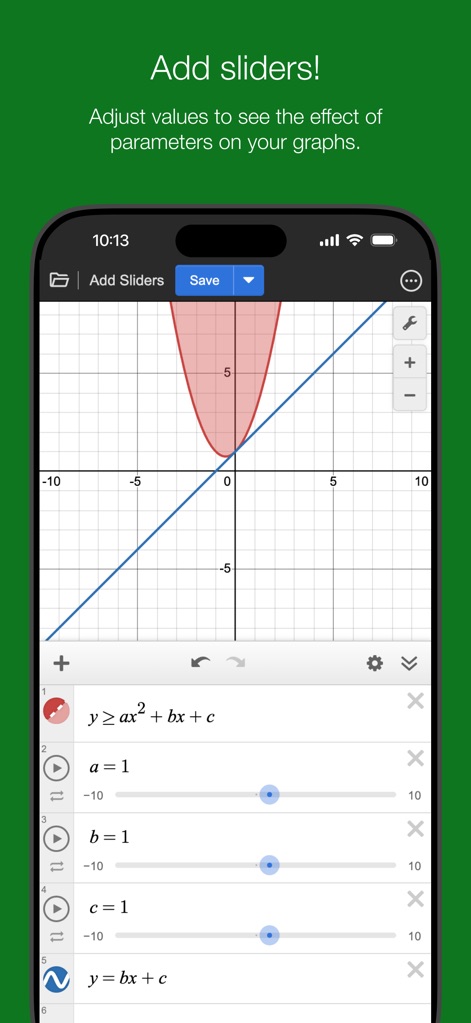
スライダーを操作してパラメータ(a, b, c)の変化によるグラフの変形をリアルタイムで視覚化し、不等式の解領域を色分けして表示します。
スライダーで動的解析
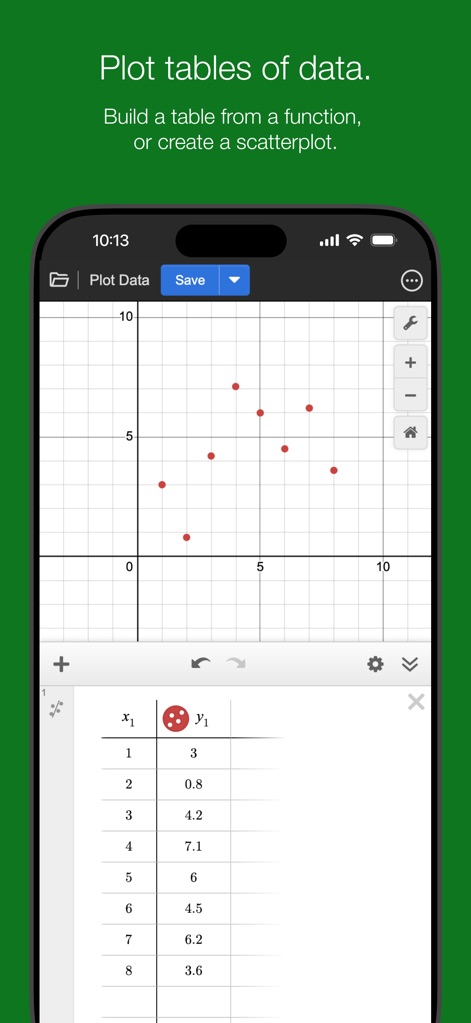
表形式で入力された数値データ(x1, y1)を基に、対応する散布図をグラフ上にプロットして視覚的に分析できます。
データと散布図
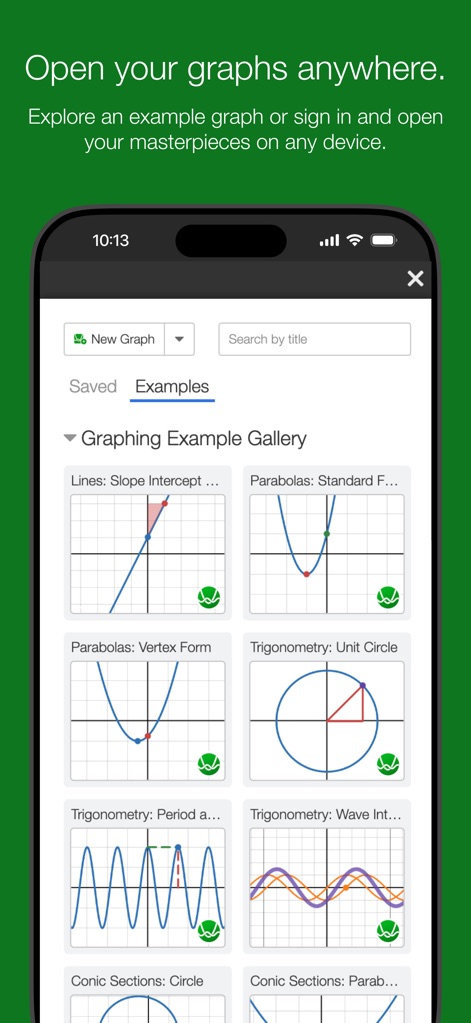
「例」ギャラリーを通じて様々な数学的テーマ(放物線、三角関数)の事前作成されたグラフを探索し、学習を深めます。
グラフ例で学ぶ
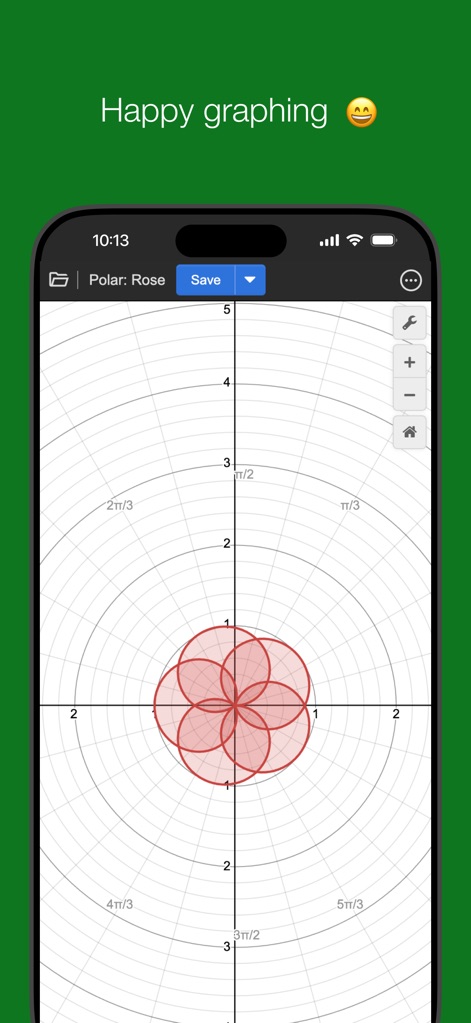
極座標系で複雑な曲線(バラ曲線)を描画し、放射状のグリッド線が特徴的な美しい図形を表現します。
極座標で表現
説明
Download
類似アプリ
似た機能とユーザー体験を持つアプリ

Calculate84
Century Light LLC

Calculator ∞
An Truong

数字ּּ统量
振龙 张

Scientific Calculator fx-991
Dinh Phuc

NCalc Scientific Calculator +
Tran Duy

HiPER Scientific Calculator
Jindrich Houska

Panecal Scientific Calculator
Noriyasu Kutsuzawa

Calculator #
An Truong

PCalc
TLA Systems Ltd.
このページはアプリまたはその開発者の公式ページではなく、情報提供および論評を目的として作成された独立した編集出版物です。明示的に別段の記載がない限り、アプリおよびその開発者は、MWM、Apple、Google Play、アプリのパブリッシャー、またはアプリの開発者と提携、承認、後援、認可、またはその他の公式的な関係はなく、このページのいかなる内容も、アプリがMWMのサービスを使用して開発されたことを意味するものではありません。すべての商標、ロゴ、スクリーンショット、その他のコンテンツはそれぞれの所有者の財産です。