このページはアプリまたはその開発者の公式ページではなく、情報提供および論評を目的として作成された独立した編集出版物です。明示的に別段の記載がない限り、アプリおよびその開発者は、MWM、Apple、Google Play、アプリのパブリッシャー、またはアプリの開発者と提携、承認、後援、認可、またはその他の公式的な関係はなく、このページのいかなる内容も、アプリがMWMのサービスを使用して開発されたことを意味するものではありません。すべての商標、ロゴ、スクリーンショット、その他のコンテンツはそれぞれの所有者の財産です。

GrafanaUI
安全でネイティブなiOSエクスペリエンスで、どこへでもダッシュボードを持ち運びましょう。FaceID保護とゼロタッチで、重要なメトリクスを監視し、複数の環境を管理し、インシデントに迅速に対応します。
ダウンロード
1K+ユーザー評価
評価数
0開発元
カテゴリ
Utilities対応言語
9最新バージョン
1.3.0サイズ
3.5 MBリリース日
2025年11月7日外出先でインフラをマスターする
GrafanaUIは、デスクに縛られずに信頼性の高いリアルタイムオブザーバビリティを必要とするDevOpsプロフェッショナルのために、高性能なネイティブiOSエクスペリエンスを提供します。
エンタープライズグレードのセキュリティ
業界標準のiOSキーチェーン暗号化で機密性の高いアクセストークンを保護し、FaceIDまたはTouchIDでダッシュボードを安全に保護します。
統合されたマルチサーバーアクセス
1つのアプリで、本番、ステージング、開発環境全体にわたるクラウドホスト型およびセルフホスト型インスタンス間を簡単に切り替えます。
以下のスクリーンショットと説明は、アプリの公式ストアリスティングから直接取得されたものであり、アプリ開発者の所有物です。
アプリストア
スクリーンショット
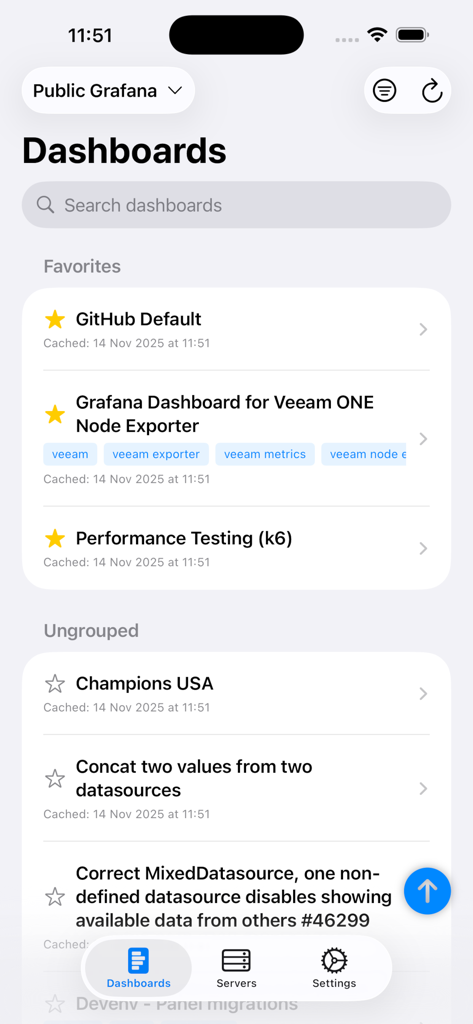
GrafanaUIモバイルアプリインターフェース。iPhoneに、お気に入りのグループ化されていない監視ダッシュボードのリストが表示されます。
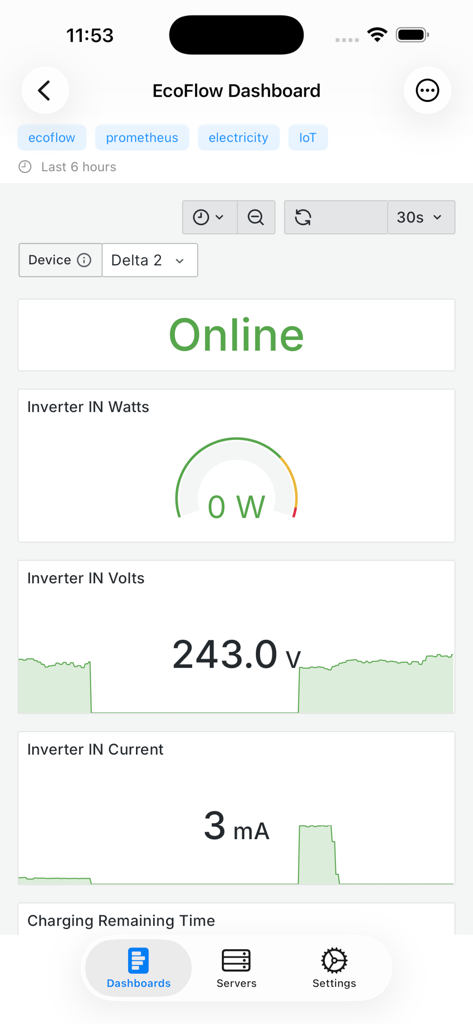
GrafanaUIモバイルアプリ。リアルタイム監視ダッシュボードに電気およびIoTメトリクスが表示されます。
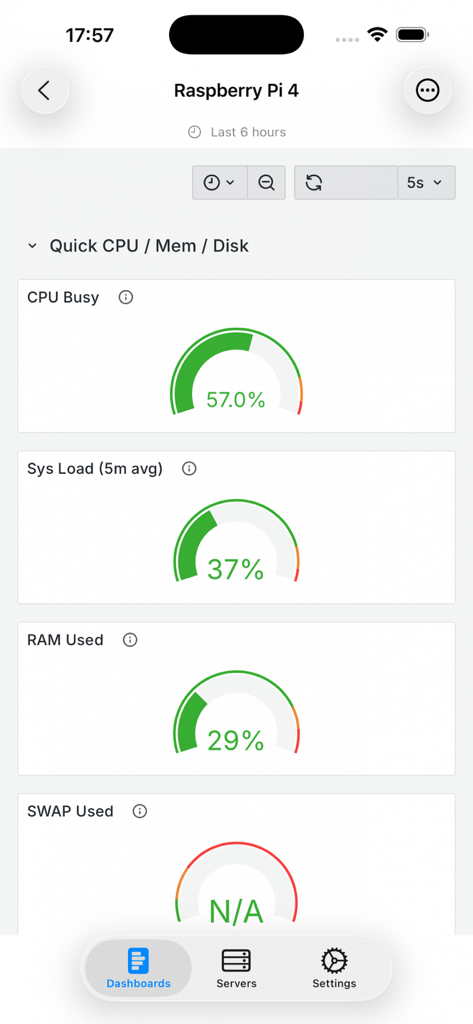
GrafanaUIモバイルアプリ。Raspberry Pi 4のシステムパフォーマンスメトリクス(CPUおよびRAM使用量を含む)が表示されます。
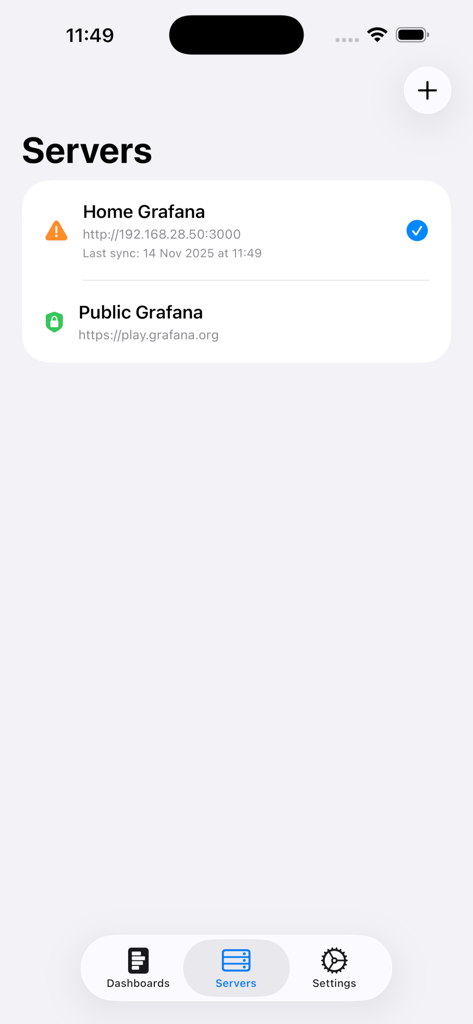
GrafanaUIモバイルアプリ画面。接続されているGrafanaサーバーのリストが表示されます。
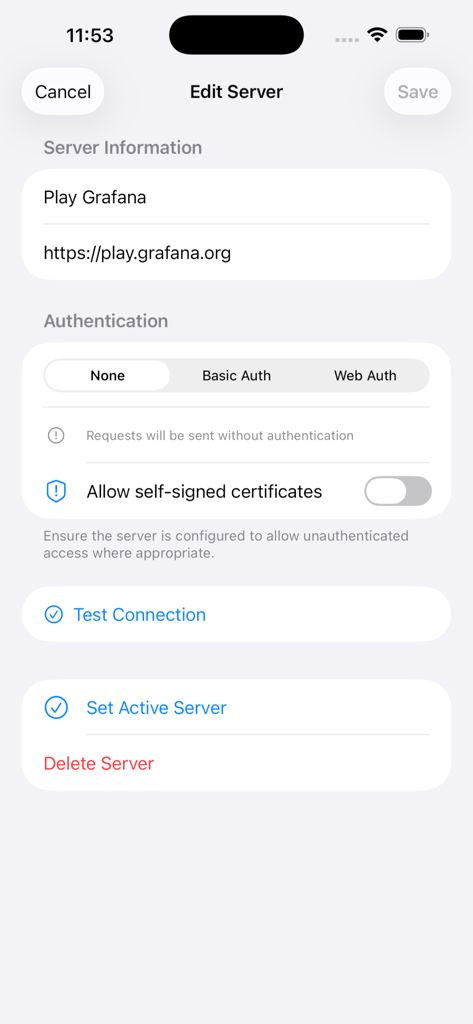
GrafanaUIモバイルアプリで、URLや認証方法などのGrafanaサーバーの詳細を編集するためのインターフェース。
説明
Download
類似アプリ
同じカテゴリのトップランクアプリ

Google LLC

Google Chrome
Google LLC

中国移动(手机营业厅)
China Mobile Online Services Co., Ltd.

Google Authenticator
Google LLC

CNH do Brasil
Servicos e Informacoes do Brasil

Cleanup: Phone Storage Cleaner
DEEP FLOW SOFTWARE SERVICES - FZCO

gov.br
Servicos e Informacoes do Brasil

中国电信-全国统一官方服务平台
CHINA TELECOM Corporation Ltd.

Microsoft Edge: AI Browser
Microsoft Corporation
このページはアプリまたはその開発者の公式ページではなく、情報提供および論評を目的として作成された独立した編集出版物です。明示的に別段の記載がない限り、アプリおよびその開発者は、MWM、Apple、Google Play、アプリのパブリッシャー、またはアプリの開発者と提携、承認、後援、認可、またはその他の公式的な関係はなく、このページのいかなる内容も、アプリがMWMのサービスを使用して開発されたことを意味するものではありません。すべての商標、ロゴ、スクリーンショット、その他のコンテンツはそれぞれの所有者の財産です。