This page is not an official page of the app or its developer, but an independent editorial publication created for informational and commentary purposes. Unless expressly stated otherwise, neither the app nor its developer is affiliated with, endorsed by, sponsored by, authorized by, or otherwise officially connected with MWM, Apple, Google Play, the app publisher, or the app's developer, and nothing on this page implies that the app was developed using MWM's services. Any trademarks, logos, screenshots, and other content remain the property of their respective owners.

Teaching Graphs
Empower your students to visualize their world. From Venn diagrams to pie charts, Teaching Graphs makes data literacy fun and accessible for young learners without the complexity of spreadsheets.
Downloads
87K+User Rating
Total Ratings
0Publisher
Category
EducationLocales
1Latest Version
1.43Size
18.4 MBFirst Released
Aug 23, 2012Empower Young Minds with Data Literacy
A distraction-free environment where students focus on the logic of graphs rather than the complexity of professional software.
Effortless Graph Making
Skip the spreadsheets. Students create colorful Venn, Carroll, and Pie charts with intuitive drag-and-drop tools.
Real-World Data Reading
Develop critical thinking by interpreting live weather data and relatable datasets designed for early learners.
The following screenshots and description are sourced directly from the app's official store listing and are the property of the app developer.
App Store
Screenshots
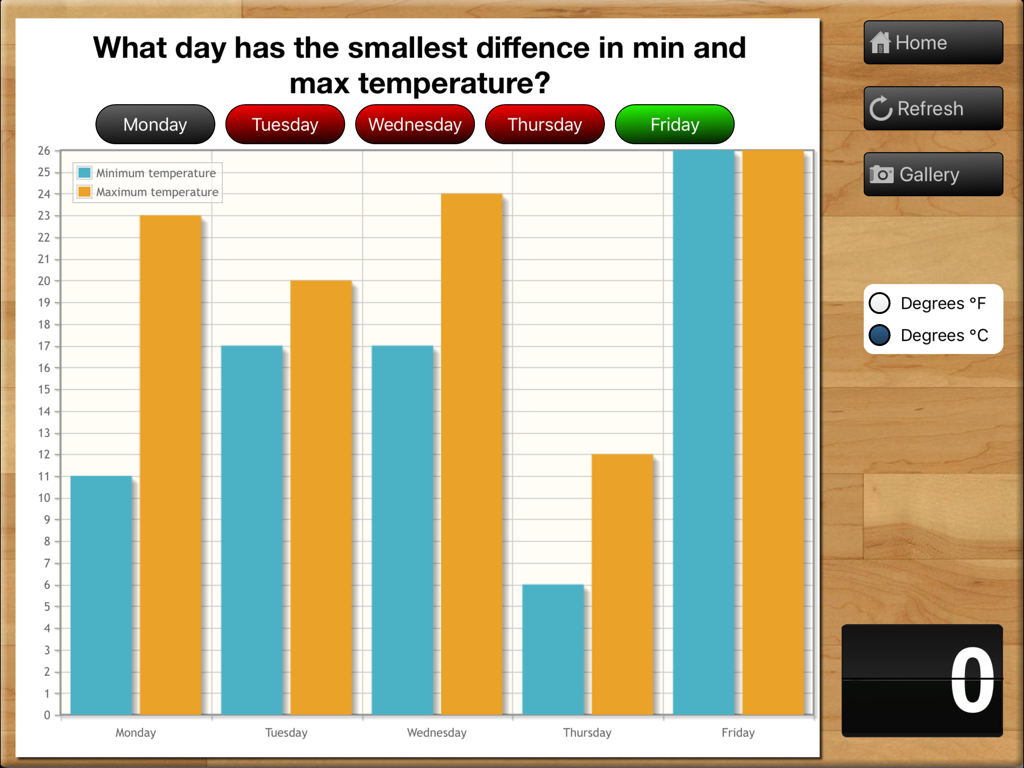
An educational bar chart showing minimum and maximum temperature comparisons for a five day school week.
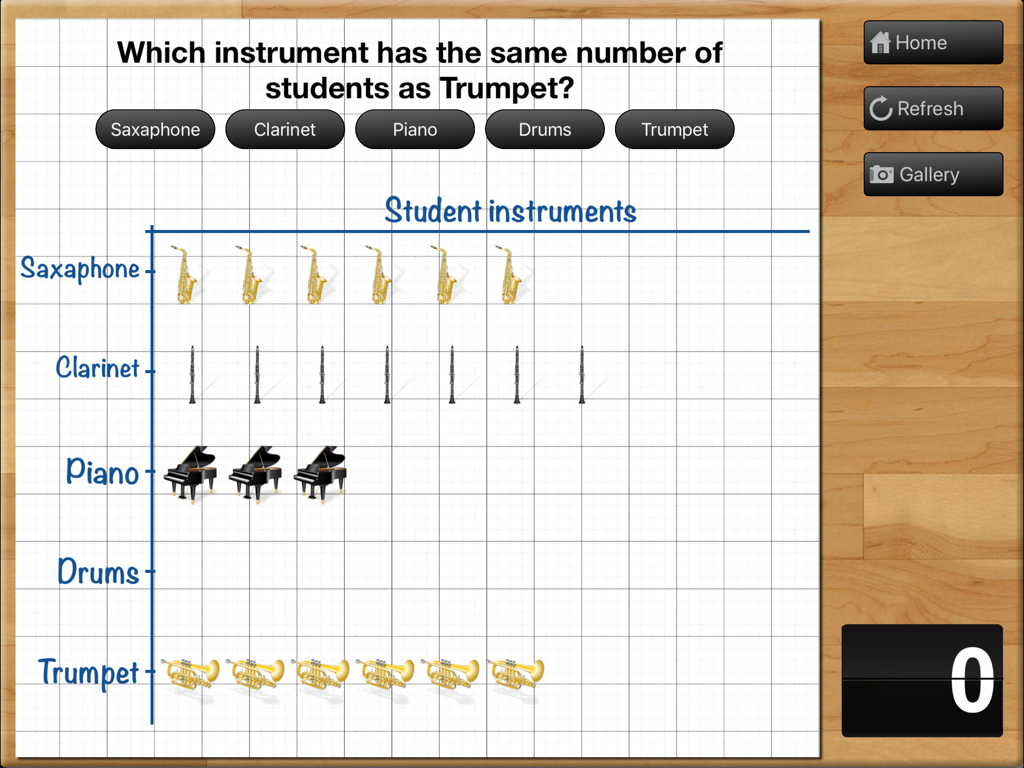
A picture graph showing student instruments data on a grid within the Teaching Graphs iPad app
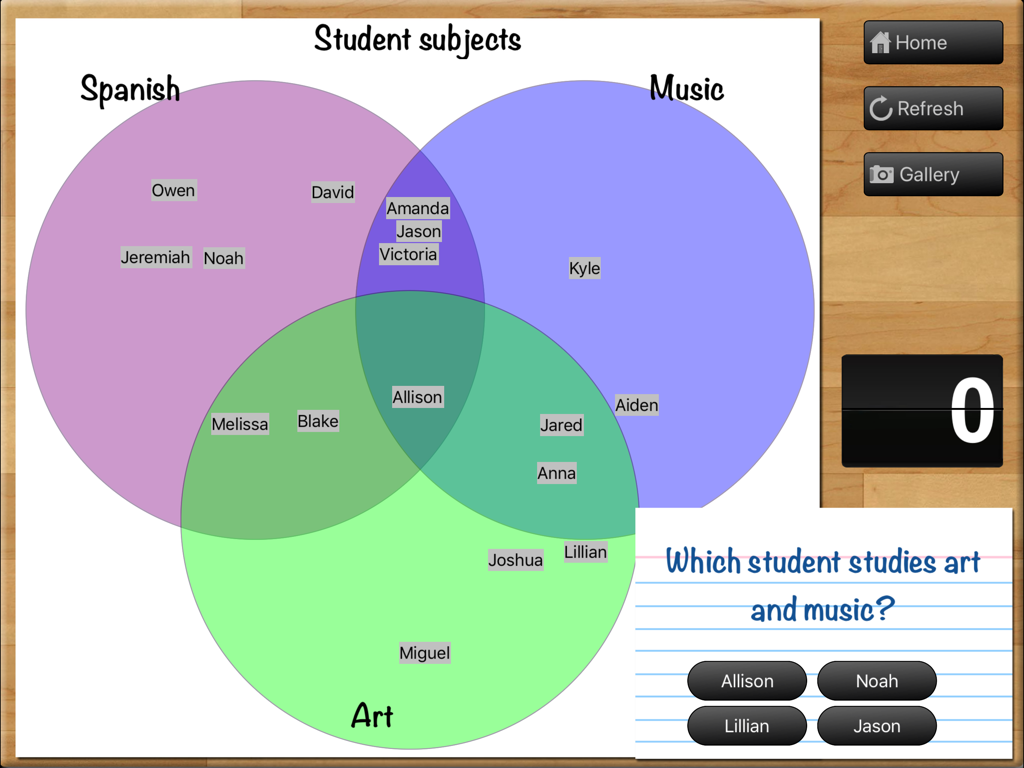
A three-circle Venn diagram in the Teaching Graphs app used to quiz students on overlapping categories for Spanish, Music, and Art.
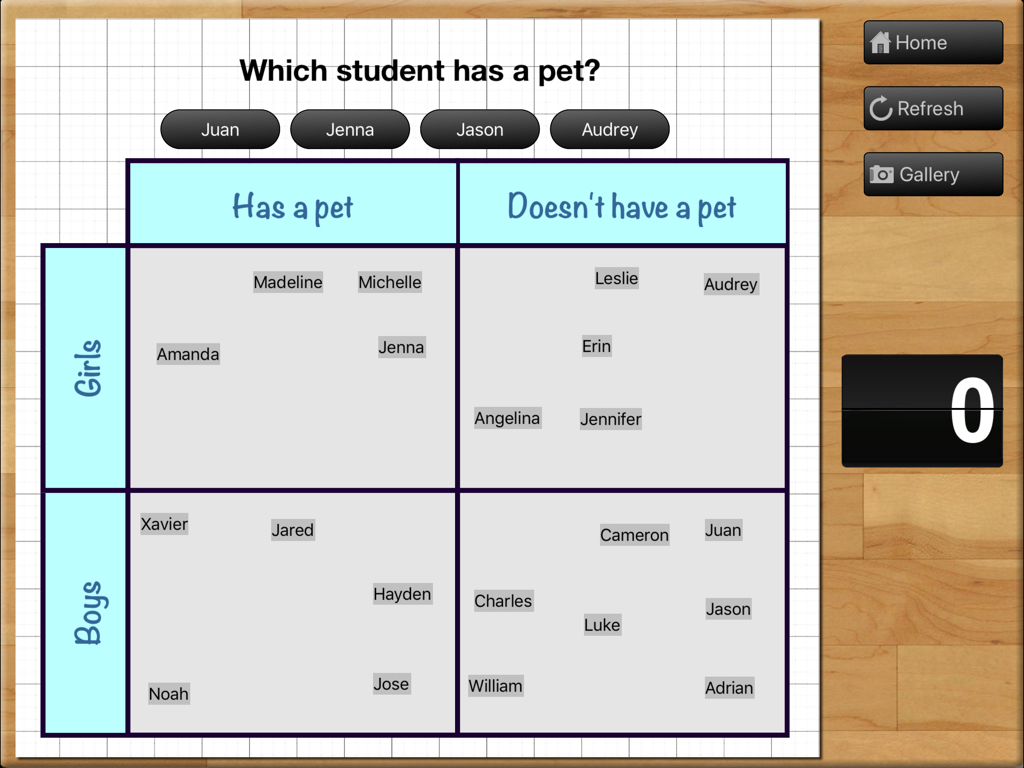
A Carroll diagram activity in the Teaching Graphs app showing a grid to sort boys and girls by pet ownership.
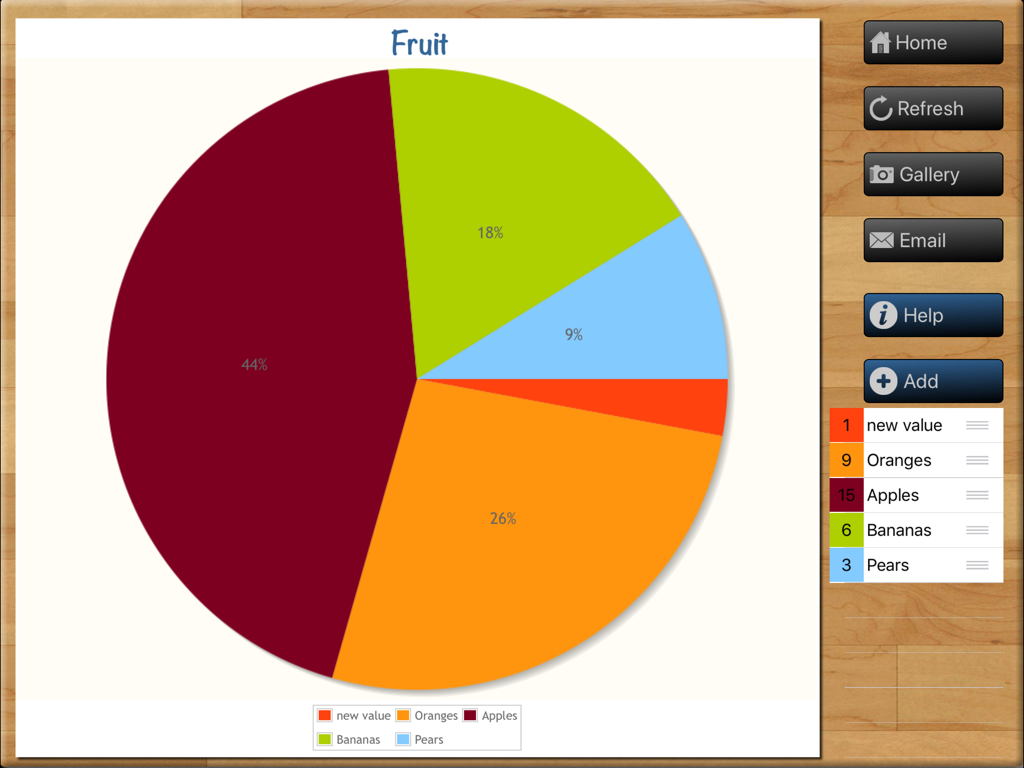
A fruit-themed pie chart being created in the Teaching Graphs educational iPad app showing data for apples, oranges, and bananas.
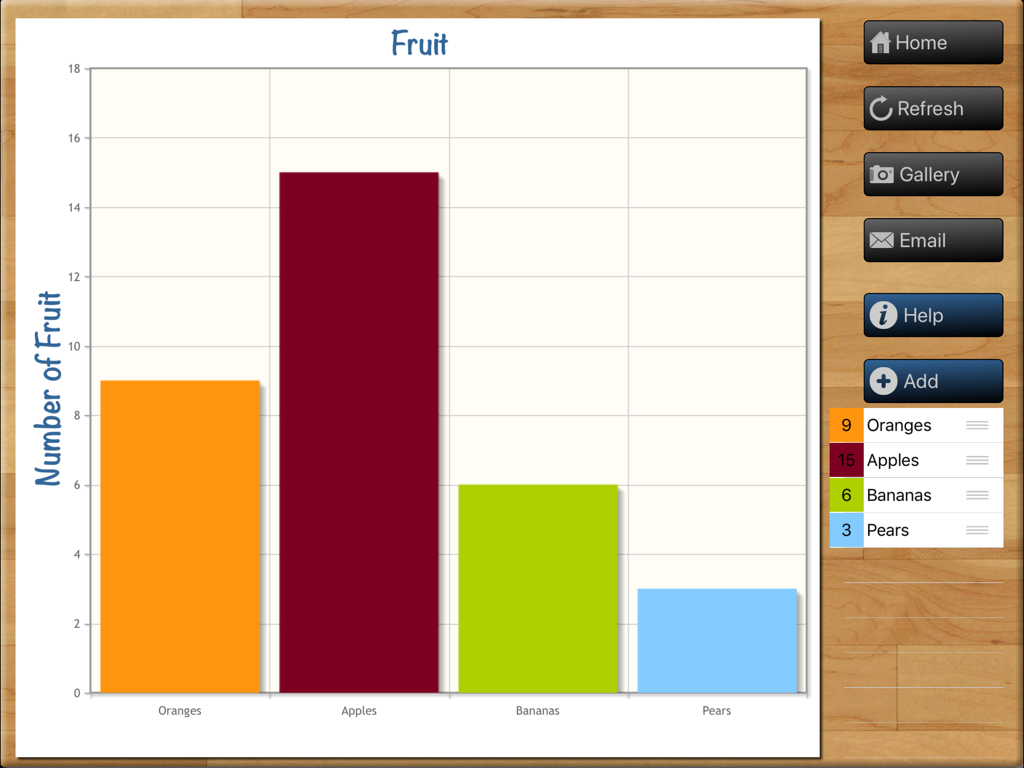
A colorful bar chart titled Fruit within the Teaching Graphs app interface on an iPad
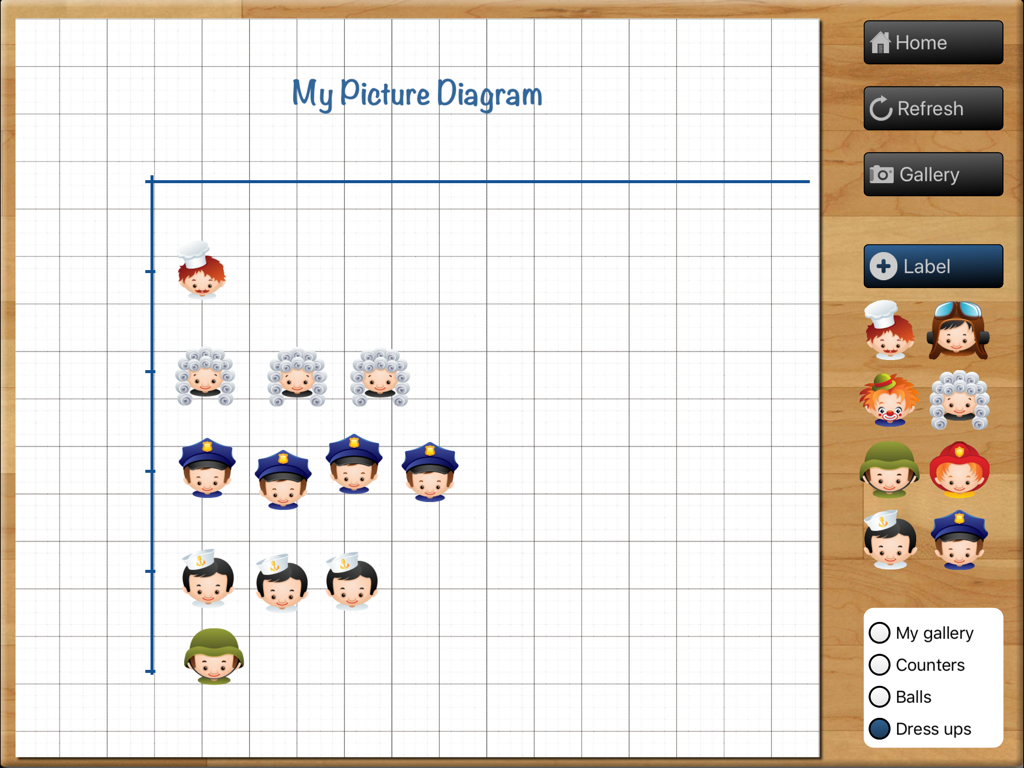
Interface of the Teaching Graphs app showing a picture diagram creator with character icons on a grid
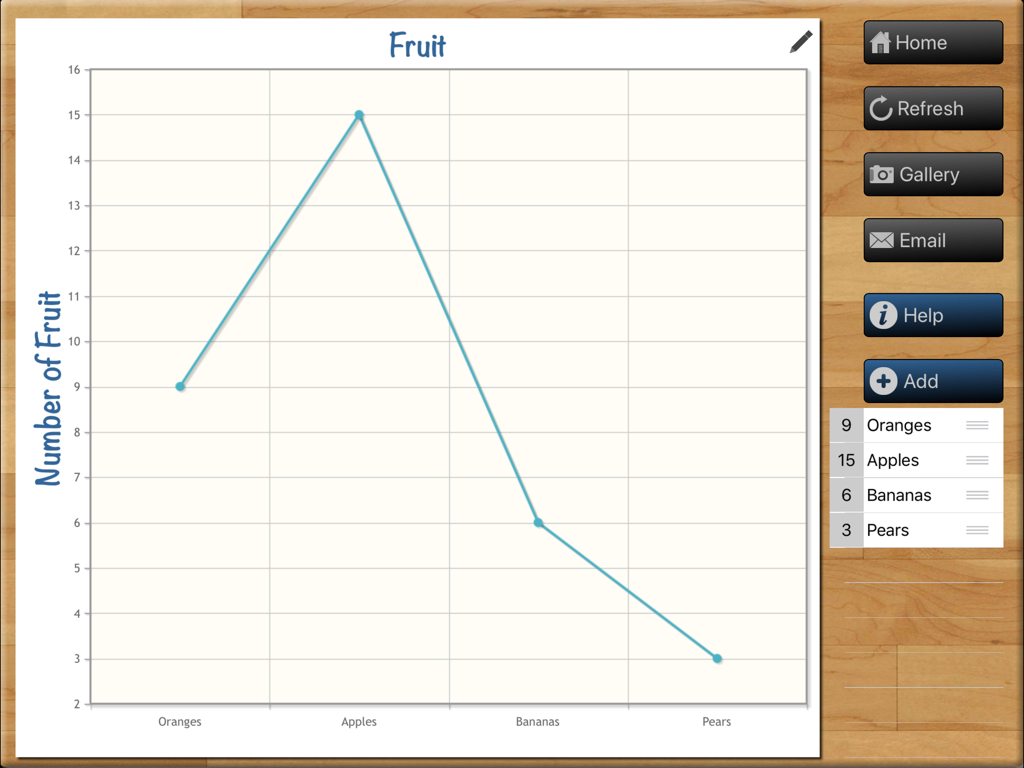
A line chart showing fruit counts in the Teaching Graphs iPad app interface
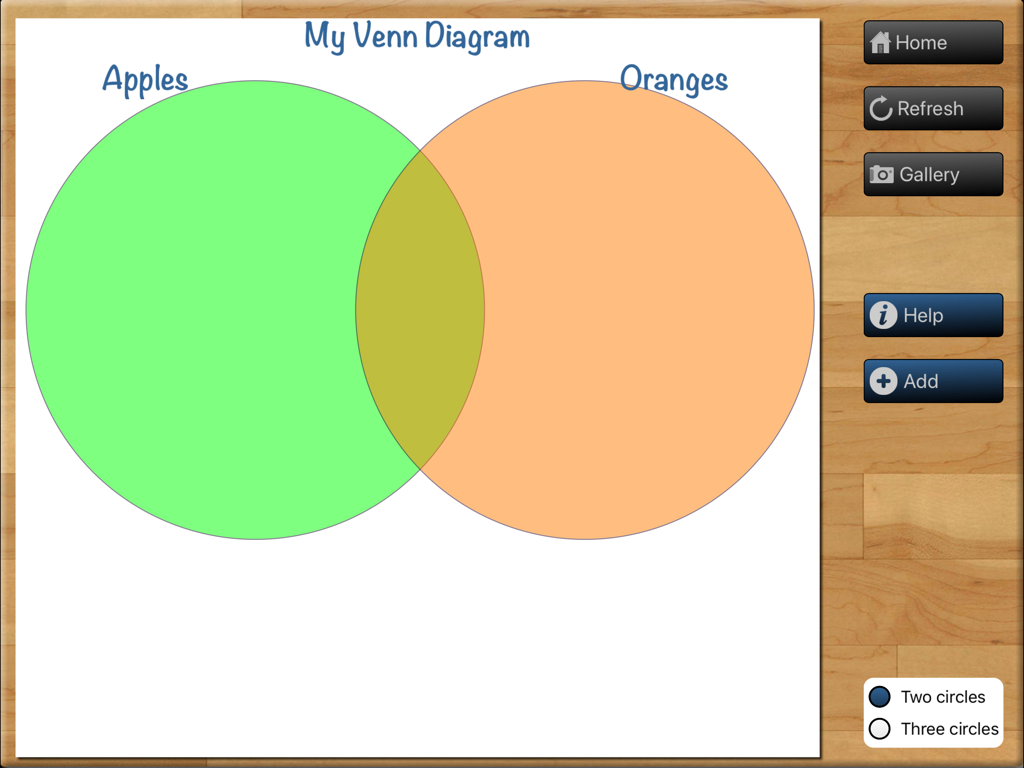
Teaching Graphs app interface for creating a Venn diagram with two overlapping circles labeled Apples and Oranges.
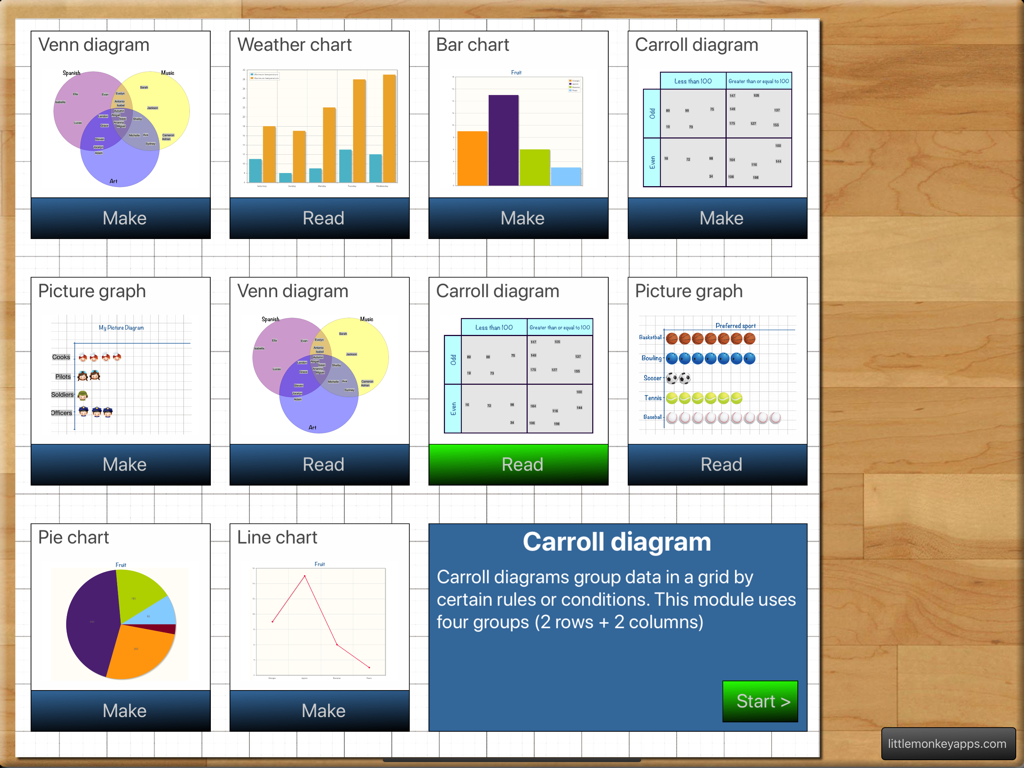
The main menu of the Teaching Graphs app featuring various types of charts and diagrams for students to read or create.
Description
Download
More Like This
Top-ranked apps in the same category

Duolingo - Language Lessons
Duolingo, Inc

Speak & Learn English: Learna
DEEP FLOW SOFTWARE SERVICES - FZCO

驾考宝典-科一科四驾驶证考试驾考通
Wuhan Jiakaobaodian Information Service Co., Ltd.

Toca Boca World
Toca Boca AB

Google Classroom
Google LLC

作业帮-中小学家长作业检查和辅导工具
Guangzhou Polar Future Culture Technology Co., Ltd

学信网
Student Information Consultation Service Co., Ltd.

Gauth: AI Study Companion
GAUTHTECH PTE. LTD.

ArtWorkout: Learn How to Draw
Aleksandr Ulitin
This page is not an official page of the app or its developer, but an independent editorial publication created for informational and commentary purposes. Unless expressly stated otherwise, neither the app nor its developer is affiliated with, endorsed by, sponsored by, authorized by, or otherwise officially connected with MWM, Apple, Google Play, the app publisher, or the app's developer, and nothing on this page implies that the app was developed using MWM's services. Any trademarks, logos, screenshots, and other content remain the property of their respective owners.