This page is not an official page of the app or its developer, but an independent editorial publication created for informational and commentary purposes. Unless expressly stated otherwise, neither the app nor its developer is affiliated with, endorsed by, sponsored by, authorized by, or otherwise officially connected with MWM, Apple, Google Play, the app publisher, or the app's developer, and nothing on this page implies that the app was developed using MWM's services. Any trademarks, logos, screenshots, and other content remain the property of their respective owners.

Desmos Graphing Calculator
It democratizes complex visualization. Users gain mastery over data, seeing every equation's true form.
Downloads
7.5M+User Rating
Total Ratings
5.2KPublisher
Category
EducationLocales
18Latest Version
7.48.0Size
17.5 MBFirst Released
Jun 18, 2013A comprehensive evaluation of core functionalities for STEM users.
Desmos Graphing Calculator: Analytical Feature Review
Advanced Graphing Capabilities
The app provides a robust graphing engine capable of plotting a wide variety of mathematical expressions, including polar, Cartesian, and parametric equations, without limitations on the number of concurrent graphs.
Interactive Points of Interest
This tool automatically highlights and allows users to identify critical points such as maximums, minimums, and intersections on a graph, providing instant coordinate readouts for analytical purposes.
Dynamic Sliders for Parameters
It allows users to interactively adjust parameters with sliders, facilitating dynamic exploration of function transformations and the visualization of variable effects on graphs.
Integrated Scientific Calculator
The app integrates a comprehensive scientific calculator capable of solving complex equations and evaluating a wide range of mathematical functions, including roots, logarithms, and absolute values.
Statistical Regression Tools
This tool offers integrated statistical capabilities to compute best-fit lines, parabolas, and other regression models, supporting data analysis and predictive modeling.
Inequality Plotting
It enables users to visualize and plot both Cartesian and polar inequalities, making it a powerful feature for understanding regions, constraints, and solution sets.
Data and Function Tables
The app features the ability to create and plot data tables, as well as generate input-output tables for any defined function, aiding in systematic data analysis and understanding function behavior.
Flexible Zooming and Window Control
This tool allows users to precisely control the graphical view by scaling axes independently or simultaneously, ensuring detailed examination of specific regions or overall function trends.
Frequently Asked Questions
Everything you need to know about Desmos Graphing Calculator
Is the Desmos Graphing Calculator app free to use?
Yes, the Desmos Graphing Calculator app is completely free to use. Users can access all its powerful graphing features, including plotting equations, adding sliders, and creating tables, without any cost.
What types of graphs can the Desmos Graphing Calculator plot?
The Desmos Graphing Calculator plots polar, Cartesian, and parametric graphs. It supports plotting any equation, such as lines, parabolas, derivatives, and Fourier series, without requiring expressions in y= form.
Can I use sliders in the Desmos Graphing Calculator app?
Yes, the Desmos Graphing Calculator app allows users to add sliders. These sliders enable interactive adjustment of values to build intuition or animate parameters to visualize their effect on a graph.
Does Desmos Graphing Calculator work offline?
Yes, the Desmos Graphing Calculator app functions completely offline. Users do not need internet access to plot equations, add sliders, create tables, or utilize other graphing features.
How does Desmos Graphing Calculator handle data input and plotting?
The Desmos Graphing Calculator allows users to input and plot data by creating tables. Users can also generate an input-output table for any function or build a scatterplot directly from data.
Can Desmos Graphing Calculator help find points of interest on a graph?
Yes, the Desmos Graphing Calculator identifies points of interest. Users can touch a curve to display maximums, minimums, and points of intersection, and tap gray points to view their coordinates.
Is the Desmos Graphing Calculator accessible for users with disabilities?
Yes, Desmos Graphing Calculator includes accessibility features. It supports reading and editing math using a screen reader or refreshable Braille display, and offers audio trace to explore graphs via sound.
Can I save and open Desmos Graphing Calculator graphs on multiple devices?
Yes, users can open their Desmos Graphing Calculator graphs anywhere. By signing in, users can explore example graphs or access their saved masterpieces on any compatible device.
Does the Desmos Graphing Calculator app include a scientific calculator?
Yes, the Desmos Graphing Calculator features an integrated scientific calculator. Users can type in any equation to solve it, with support for functions like square roots, logs, and absolute value.
The following screenshots and description are sourced directly from the app's official store listing and are the property of the app developer.
App Store
Screenshots
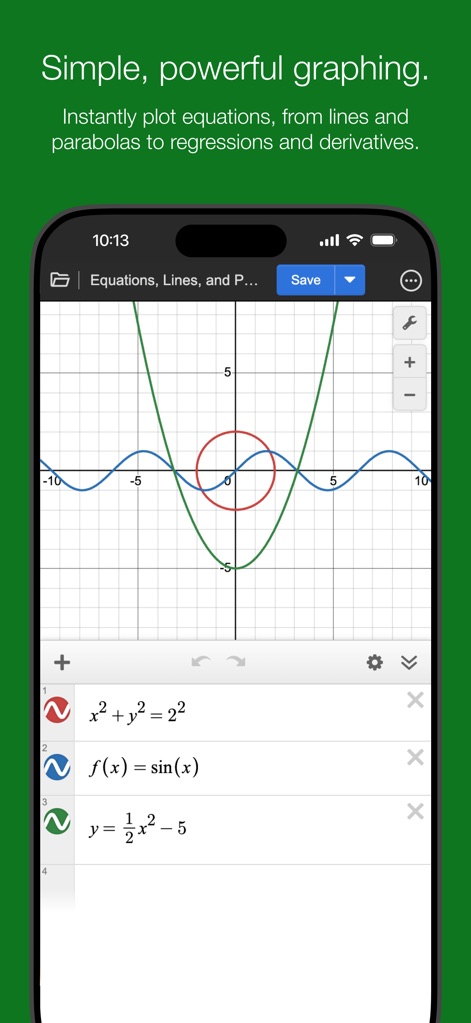
This tool demonstrates its powerful graphing capabilities, showcasing the simultaneous plotting of multiple expressions and the intuitive equation input interface.
Dynamic Equation Plotting
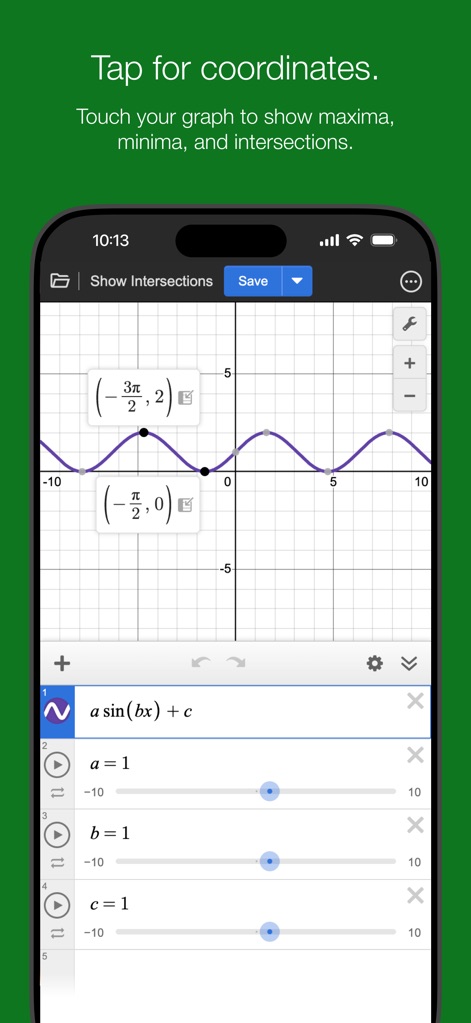
Users can precisely analyze graphs, revealing key points of interest and their exact coordinate values with simple taps.
Interactive Point Analysis
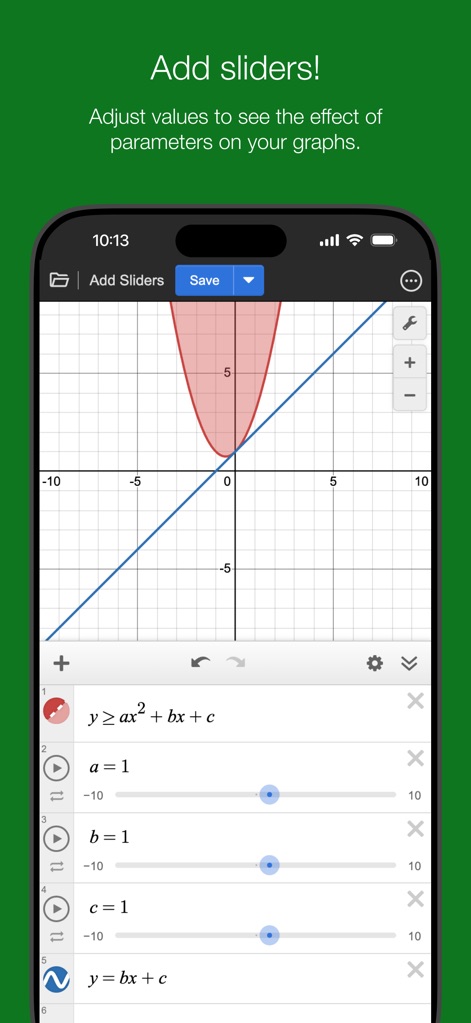
The app empowers exploration through interactive sliders for real-time parameter adjustment and clear visualization of inequality plotting on the graph.
Parameter Control & Inequalities
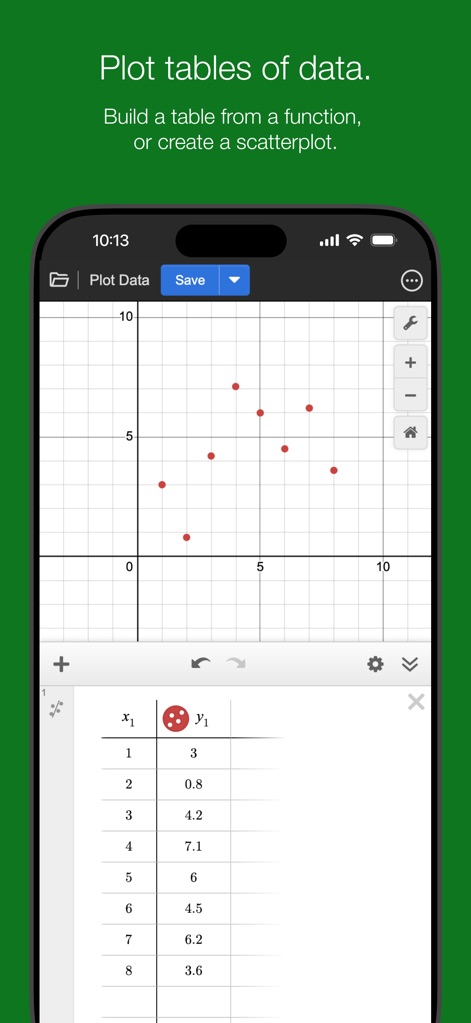
This functionality allows for efficient data plotting, seamlessly transforming raw numbers from the table input interface into visual representations.
Data Visualization Tables
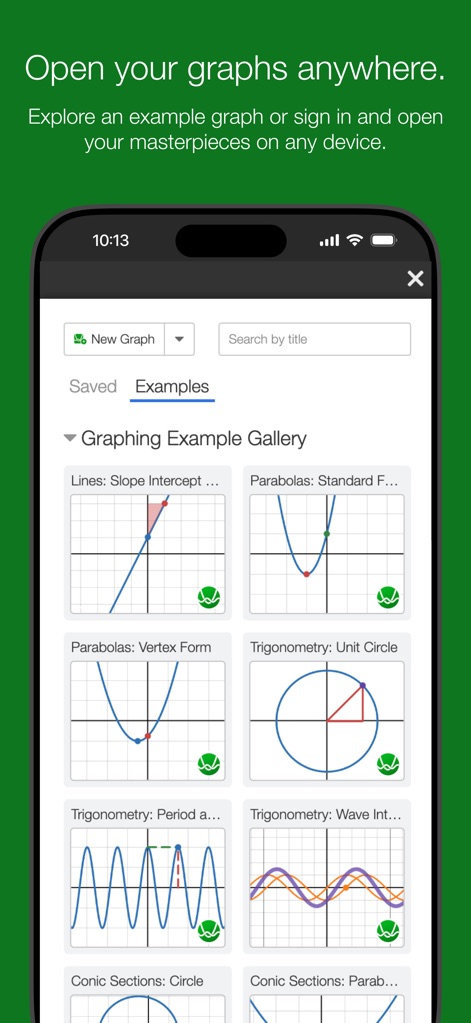
The app offers a comprehensive example gallery and supports access to diverse graph types, aiding learning and quick reference.
Graph Library Access
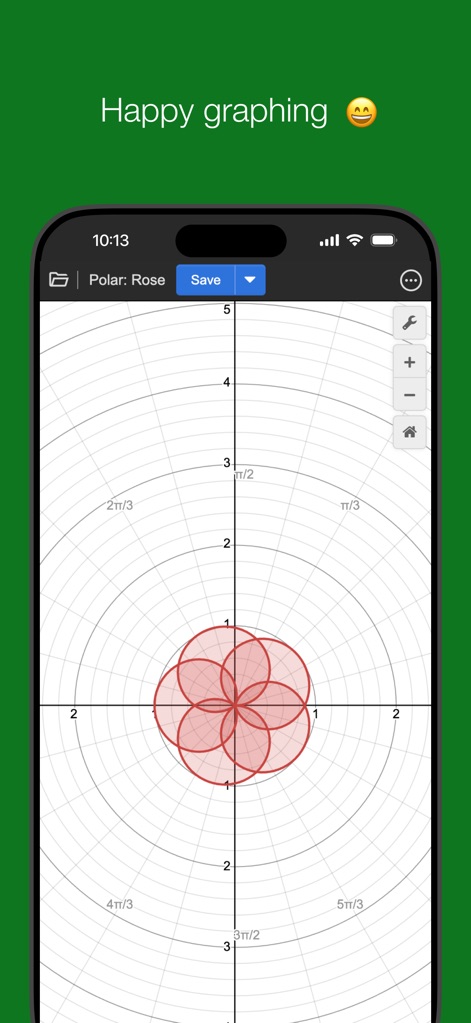
This tool excels in rendering complex curve types, specifically demonstrating its capability within the polar coordinate system.
Advanced Polar Plotting
Description
Download
More Like This
Apps with similar features and user experience

Calculate84
Century Light LLC

Calculator ∞
An Truong

数字ּּ统量
振龙 张

Scientific Calculator fx-991
Dinh Phuc

NCalc Scientific Calculator +
Tran Duy

HiPER Scientific Calculator
Jindrich Houska

Panecal Scientific Calculator
Noriyasu Kutsuzawa

Calculator #
An Truong

PCalc
TLA Systems Ltd.
This page is not an official page of the app or its developer, but an independent editorial publication created for informational and commentary purposes. Unless expressly stated otherwise, neither the app nor its developer is affiliated with, endorsed by, sponsored by, authorized by, or otherwise officially connected with MWM, Apple, Google Play, the app publisher, or the app's developer, and nothing on this page implies that the app was developed using MWM's services. Any trademarks, logos, screenshots, and other content remain the property of their respective owners.