이 페이지는 앱이나 개발자의 공식 페이지가 아니며, 정보 제공 및 논평을 목적으로 작성된 독립 편집 간행물입니다. 명시적으로 달리 언급되지 않는 한, 해당 앱이나 개발자는 MWM, Apple, Google Play, 앱 퍼블리셔 또는 앱 개발자와 제휴, 보증, 후원, 승인 또는 공식적으로 연결되어 있지 않으며, 이 페이지의 어떤 내용도 해당 앱이 MWM의 서비스를 사용하여 개발되었음을 의미하지 않습니다. 모든 상표, 로고, 스크린샷 및 기타 콘텐츠는 해당 소유자의 자산입니다.
Smith Charts
고정밀 임피던스 매칭, Touchstone 파일 지원 및 고급 장치 분석으로 연구실 워크플로우를 가속화하십시오. iPhone, iPad 및 Mac용으로 최적화된 강력한 대화형 환경을 경험하십시오.
주요 수치
다운로드
6K+
사용자 평점
5.0/5
총 평가 수
0
개발사
Edoardo Orzes
카테고리
Productivity
지원 언어
1
최신 버전
3.0.1
크기
24.2 MB
출시일
2021년 12월 29일
기능
손끝에서 펼쳐지는 정밀 RF 엔지니어링
고성능 디지털 제품군을 위해 종이 차트를 버리십시오. RF 전문가 및 엔지니어를 위해 설계된 저희 앱은 iPhone, iPad 및 Mac에서 매칭 네트워크 설계 및 복잡한 장치 분석을 위한 원활한 워크플로우를 제공합니다.
대화형 디지털 차트
고정밀 터치 제스처로 연필과 컴퍼스를 대체하십시오. 드래그, 확대/축소하고 통합된 디지털 자를 사용하여 모든 환경에서 파장, 좌표 및 임피던스를 즉시 얻으십시오.
고급 네트워크 합성
L, C, R 및 전송 라인을 사용하여 복잡한 매칭 네트워크를 설계하십시오. 기생 요소를 시뮬레이션하고 빌드하면서 실시간 임피던스 변화를 추적하여 실험실 벤치에 도달하기 전에 설계를 사양에 맞게 조정하십시오.
다음 스크린샷과 설명은 앱의 공식 스토어 목록에서 직접 가져온 것이며 앱 개발자의 자산입니다.
앱 스토어
스크린샷
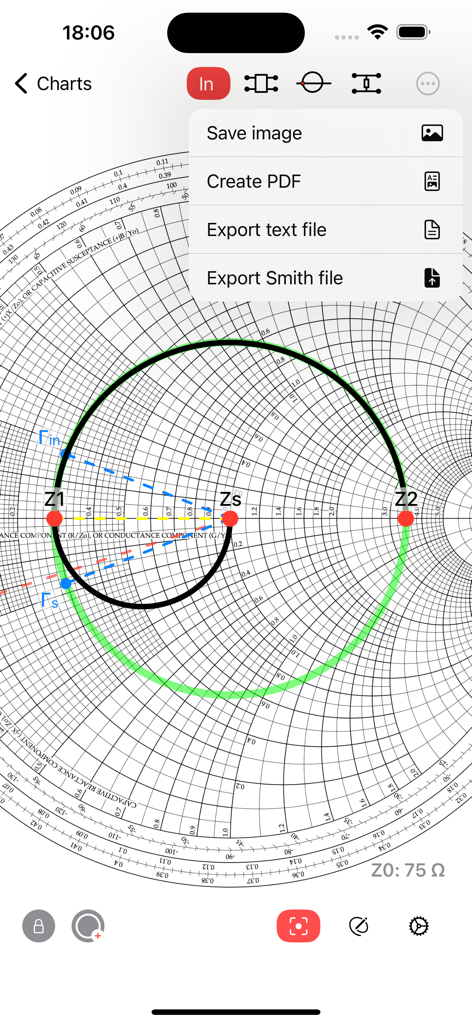
Smith Charts 앱이 스미스 차트의 임피던스 플롯 위에 PDF 및 텍스트 파일을 포함한 내보내기 옵션을 보여주고 있습니다.
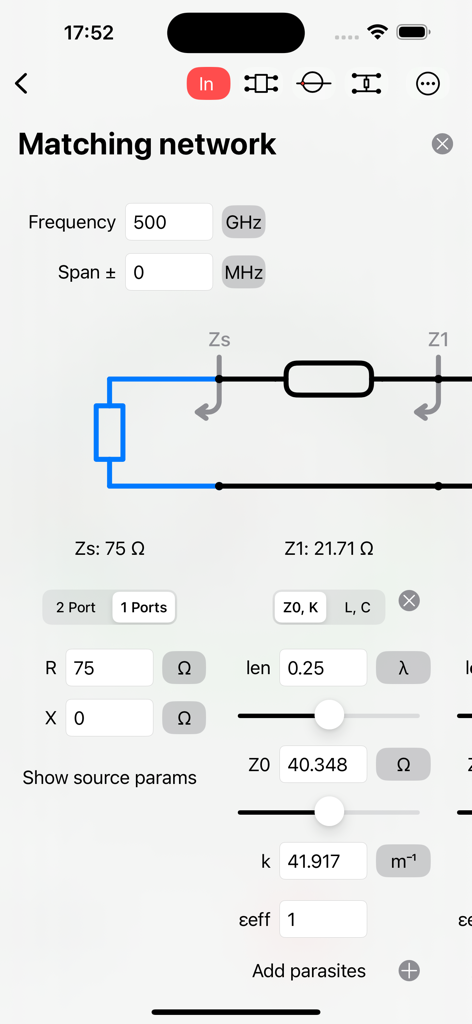
Smith Charts 앱 인터페이스가 매칭 네트워크 설계 도구 및 회로 매개변수를 보여줍니다.
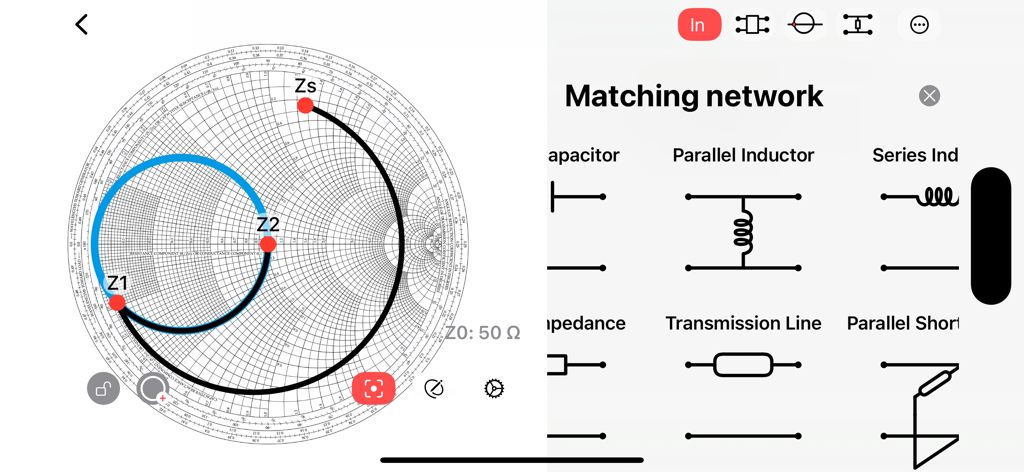
Smith Chart 앱 인터페이스가 임피던스 포인트 및 구성 요소 선택 메뉴와 함께 매칭 네트워크 설계를 보여줍니다.
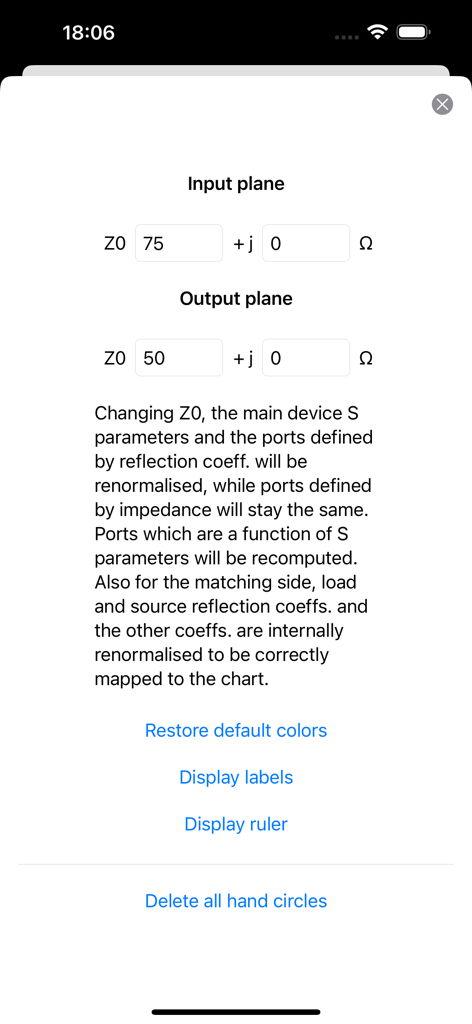
Smith Charts 앱에서 입력 및 출력 평면 임피던스 값을 구성하기 위한 설정 화면입니다.
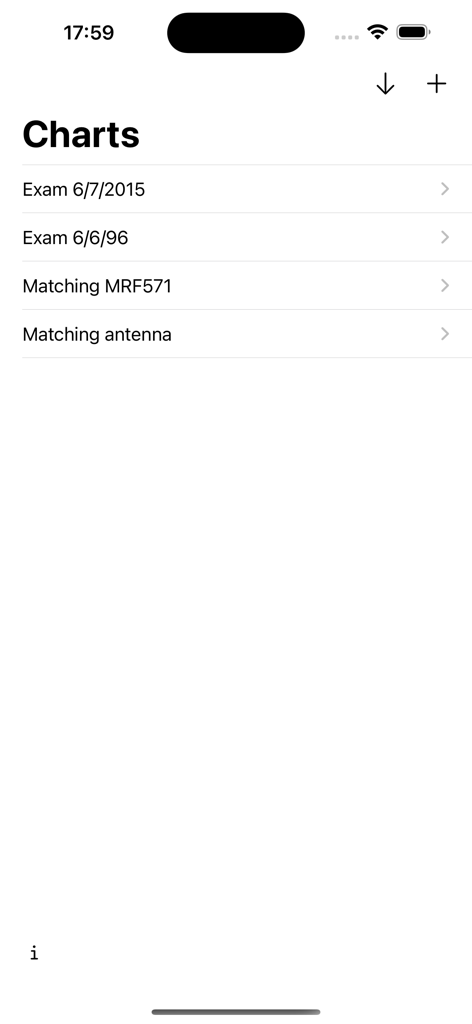
안테나 매칭 및 시험 파일을 포함하여 저장된 Smith 차트 프로젝트를 보여주는 목록 보기입니다.
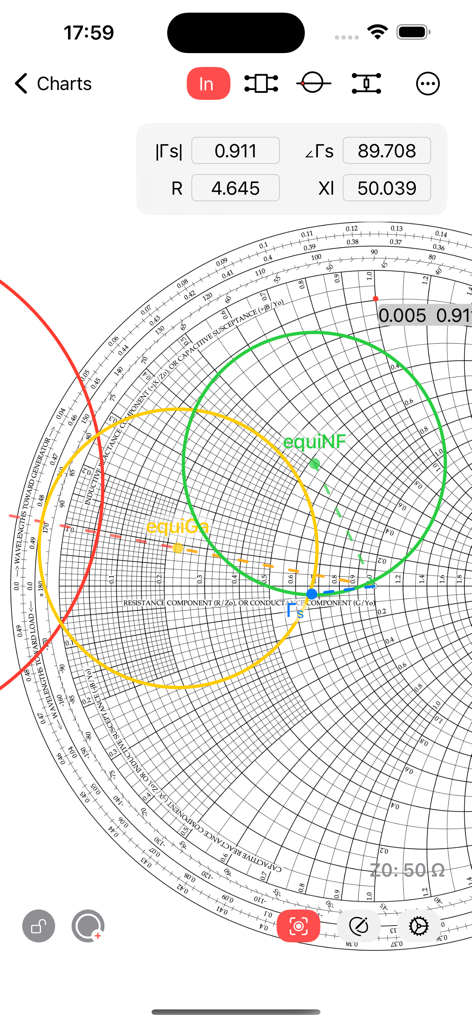
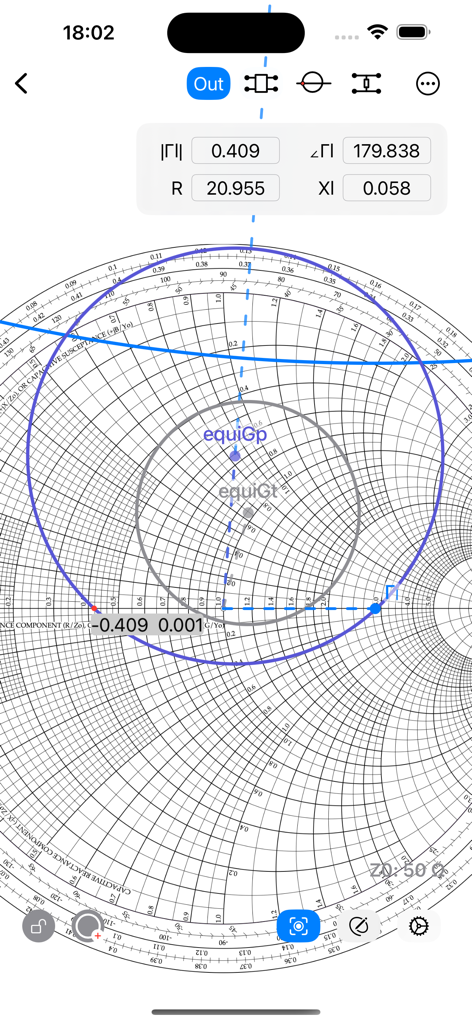
Smith Charts 앱 인터페이스가 무선 주파수 엔지니어링 설계를 위한 등배율 이득 및 등배율 노이즈 원을 표시합니다.
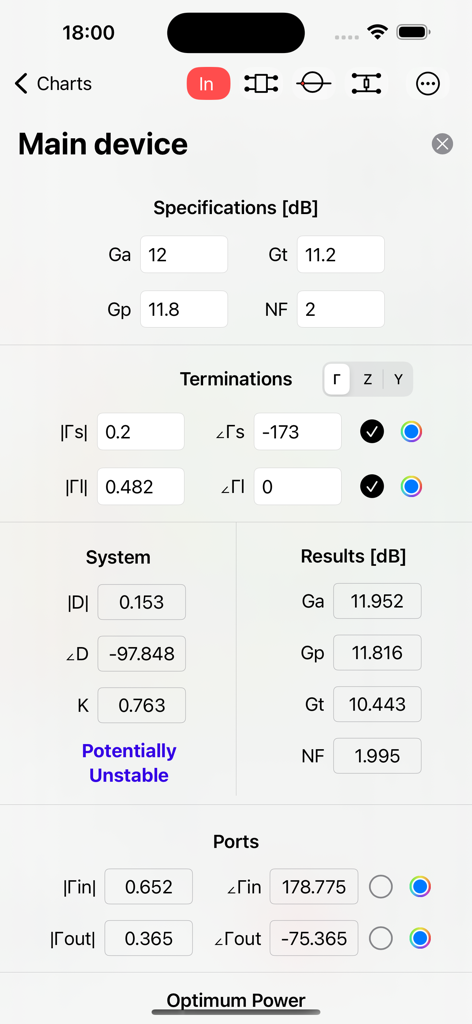
Smith Charts 앱의 상세 보기로, 무선 주파수 엔지니어링을 위한 이득 사양 및 안정성 분석을 포함한 RF 장치 매개변수를 보여줍니다.
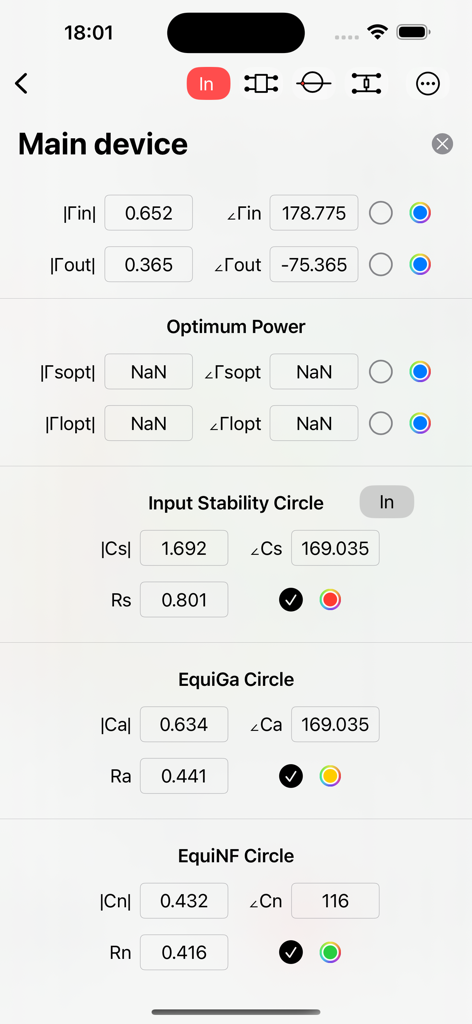
RF 엔지니어링을 위한 입력 안정성 및 노이즈 원에 대한 숫자 데이터를 보여주는 Smith Charts 앱 스크린샷입니다.
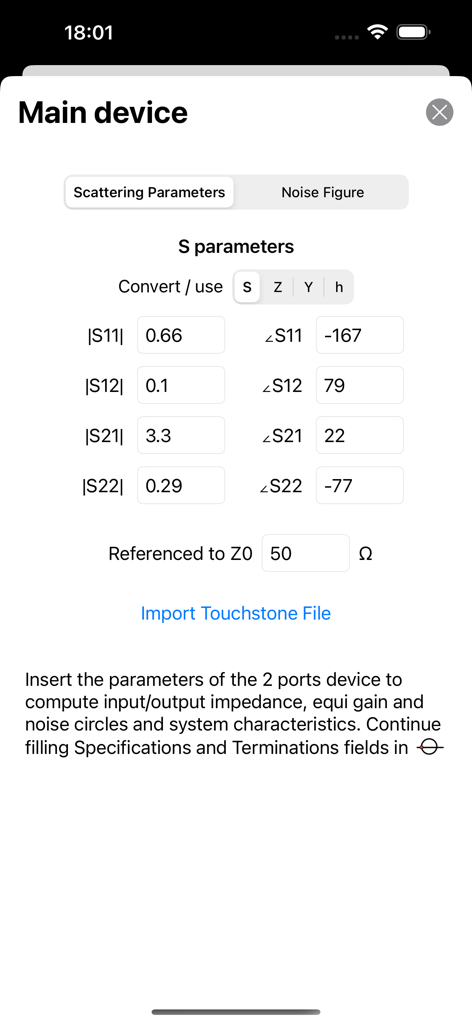
S-파라미터를 입력하고 Smith Charts 앱에서 Touchstone 파일을 가져오기 위한 인터페이스입니다.
RF 엔지니어링을 위한 복잡한 임피던스 좌표 및 전력 이득 원을 보여주는 디지털 Smith 차트 인터페이스입니다.
설명
A great experience of the Smith chart. Also in dark mode.
Design matching networks, insert S parameters and convert them, or import from touchstone file.
Compute stability circles, equi gain and noise circles.
Easy interaction with the Smith chart.
This chart can easily replace a physical one, making its use much faster.
Smith chart interactivity:
- Works on iPhone, iPad and Mac (on Apple Silicon).
- Drag and zoom in the chart.
- Create multiple Smith Charts and name them.
- Switch easily between input and output planes.
- Use a ruler and drag it to obtain the wavelength toward generator of a point on the chart, instantly.
- Tap the chart to show the coordinates in algebraic notation, you will see also magnitude and phase of that location, and the corresponding impedance.
- Insert circles by hand; modify the radius dragging a circle to keep the center in place, or press to translate them and modify the radius keeping the opposite side in place. Then use the padlock button to disable interaction of gestures with circles.
- You can also insert a custom circle and a segment in the input and in the output plane, defining its center and radius in a textfield.
- Export to file, image or PDF
Advanced tools for engineering:
Matching networks:
- Choose electronic components to design a matching network for your device.
- Available components are: L, C, R, Z and lines (transmission line, parallel or series stub, open or shorted).
- For each component it is possible to specify the parasites.
- For transmission lines, it is possible to choose between Z0, K or L, C representations, and converting between the two (also for parasites).
- Tapping on a component it is added to the network and the impedance seen from your device toward the matching network is shown on the smith chart.
- You can create a matching network both for input and output planes of the device.
- Each network has its own termination (source or load), which can be a one port device or a two ports device where you can choose a termination for the second port.
- Each termination can be defined by network parameters (S, Z, Y or h) and the parameters can be imported from a touchstone file.
- Components supported: Resistor, Capacitor, Inductor, General impedance (R+jX), Transmission line, Parallel stub, series Stub (both shorted or open).
- Each component can be cascaded in series or in parallel, no limits of components.
- You can choose a frequency for the impedance calculation and a frequency span for the plot on the Smith Chart.
- For S parameters, you can specify a dedicated characteristic impedance, the tool will renormalize the Γ of that termination to be correctly shown on the Smith chart, when the smith chart is defined on a different characteristic impedance.
Device analysis:
- You can insert the following parameters of a device: network parameters (S, Z, Y or h), specifications (Ga, Gp, Gt, NF), noise data (gamma s optimum noise, minimum NF, rn) and the input/output reflection coefficients.
- You can convert network parameters (S, Z, Y, h), and the port type (Γ, Z, Y).
- While you are inserting data, you will see the computed results appearing on the chart and on the relative fields.
- Results representable on the smith chart: input/output stability circles, power gain and noise circles (equiGa, Gp, Gt, NF circles), reflection coefficients towards load and source and optimum power coefficients.
- Other results: obtained power gains and noise (Ga, Gp, Gt, NF) and stability (D, K, kind of stability).
- You can display on the Smith chart the input impedance of your component versus frequency (as a function of load impedance) when importing a touchstone file.
- For S parameters, you can specify a different characteristic impedance and the tool will automatically convert it to the one defined for the Smith chart, it will let you know the new renormalized parameters.
이 페이지는 앱이나 개발자의 공식 페이지가 아니며, 정보 제공 및 논평을 목적으로 작성된 독립 편집 간행물입니다. 명시적으로 달리 언급되지 않는 한, 해당 앱이나 개발자는 MWM, Apple, Google Play, 앱 퍼블리셔 또는 앱 개발자와 제휴, 보증, 후원, 승인 또는 공식적으로 연결되어 있지 않으며, 이 페이지의 어떤 내용도 해당 앱이 MWM의 서비스를 사용하여 개발되었음을 의미하지 않습니다. 모든 상표, 로고, 스크린샷 및 기타 콘텐츠는 해당 소유자의 자산입니다.