This page is not an official page of the app or its developer, but an independent editorial publication created for informational and commentary purposes. Unless expressly stated otherwise, neither the app nor its developer is affiliated with, endorsed by, sponsored by, authorized by, or otherwise officially connected with MWM, Apple, Google Play, the app publisher, or the app's developer, and nothing on this page implies that the app was developed using MWM's services. Any trademarks, logos, screenshots, and other content remain the property of their respective owners.

GridCarbon
Empower your sustainable lifestyle with precision data. Monitor live carbon intensity and the energy generation mix every five minutes to intelligently shift your usage and reduce your environmental impact.
Downloads
2K+User Rating
Total Ratings
100Publisher
Category
UtilitiesLocales
1Latest Version
1.16.0Size
10.2 MBFirst Released
Jan 4, 2010Optimize Your Impact with Real-Time Data
GridCarbon empowers you to make data-driven decisions, shifting your electricity use to off-peak hours when carbon intensity is at its lowest.
Intuitive Traffic Light System
Instantly identify the best times to run appliances or charge your EV by following live low-carbon indicators.
Dynamic Generation Mix
Gain professional-grade transparency with a live breakdown of renewable, nuclear, and fossil fuel energy sources.
The following screenshots and description are sourced directly from the app's official store listing and are the property of the app developer.
App Store
Screenshots
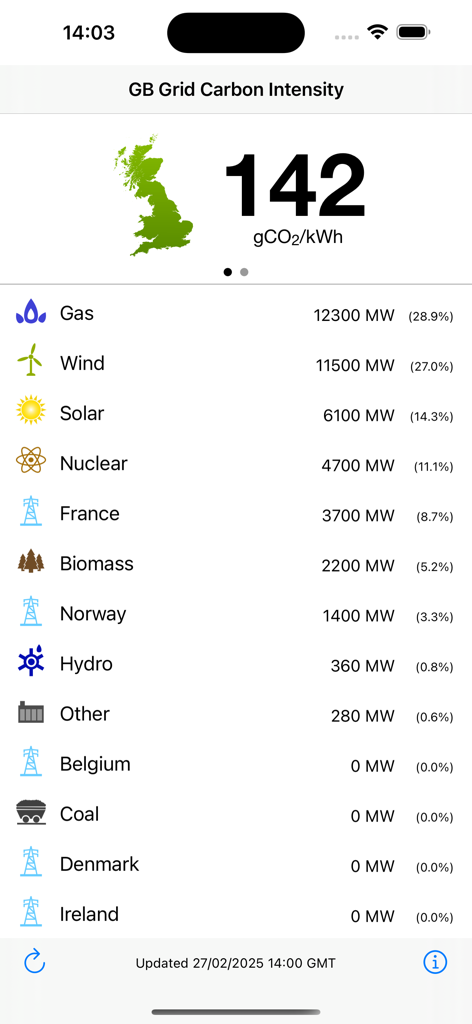
GridCarbon app dashboard displaying real-time carbon intensity and energy generation mix for Great Britain.
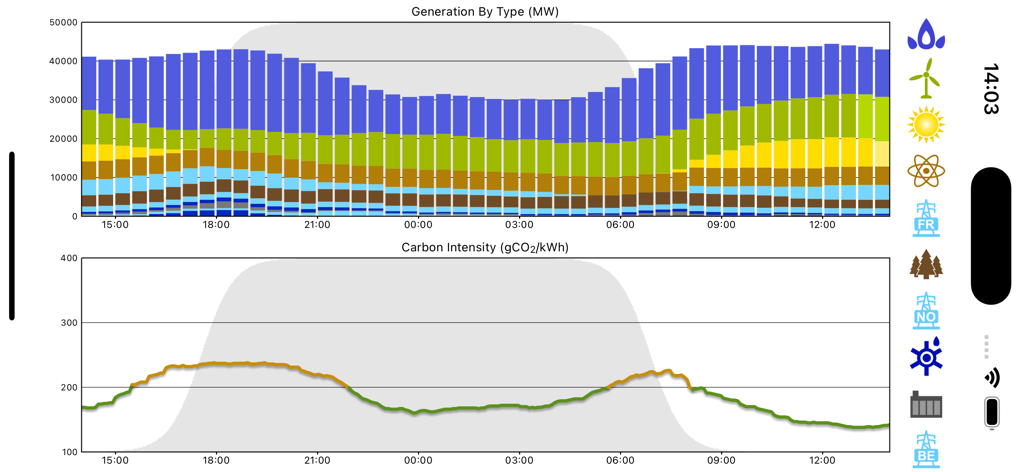
Landscape view of electricity generation mix and carbon intensity graphs over 24 hours
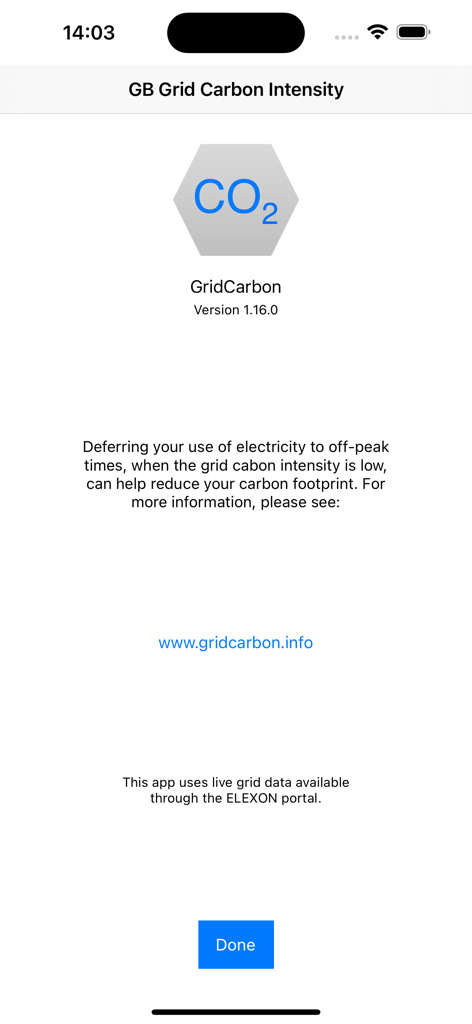
GridCarbon app info screen showing carbon intensity description and GB grid data source details
Description
Download
More Like This
Top-ranked apps in the same category

Google LLC

Google Chrome
Google LLC

中国移动(手机营业厅)
China Mobile Online Services Co., Ltd.

Google Authenticator
Google LLC

CNH do Brasil
Servicos e Informacoes do Brasil

Cleanup: Phone Storage Cleaner
DEEP FLOW SOFTWARE SERVICES - FZCO

gov.br
Servicos e Informacoes do Brasil

Microsoft Edge: AI Browser
Microsoft Corporation

Super VPN Fly 2026
YUNFAN TECHNOLOGY CO., LIMITED
This page is not an official page of the app or its developer, but an independent editorial publication created for informational and commentary purposes. Unless expressly stated otherwise, neither the app nor its developer is affiliated with, endorsed by, sponsored by, authorized by, or otherwise officially connected with MWM, Apple, Google Play, the app publisher, or the app's developer, and nothing on this page implies that the app was developed using MWM's services. Any trademarks, logos, screenshots, and other content remain the property of their respective owners.