This page is not an official page of the app or its developer, but an independent editorial publication created for informational and commentary purposes. Unless expressly stated otherwise, neither the app nor its developer is affiliated with, endorsed by, sponsored by, authorized by, or otherwise officially connected with MWM, Apple, Google Play, the app publisher, or the app's developer, and nothing on this page implies that the app was developed using MWM's services. Any trademarks, logos, screenshots, and other content remain the property of their respective owners.

PSKReporter Client
Transform your mobile device into a professional station dashboard. Visualize global FT8 and FT4 activity, benchmark your antenna performance against local peers, and master the greyline with advanced analytics designed for the dedicated amateur radio operator.
Downloads
0User Rating
Total Ratings
0Publisher
Category
UtilitiesLocales
1Latest Version
4.0Size
4.8 MBFirst Released
Jan 9, 2026Elevate Your Radio Strategy
Transform raw digital mode data into actionable intelligence. Monitor bands, track propagation, and optimize your station’s performance with pro-level visualization.
Interactive Propagation Maps
Visualize FT8 and FT4 activity globally. See signal paths, distances, and bearings to understand exactly how the ionosphere is behaving in real-time.
Smart Band Monitoring
Know which band to operate at a glance. Use traffic-light indicators and live activity trends to catch DX openings the moment they happen.
The following screenshots and description are sourced directly from the app's official store listing and are the property of the app developer.
App Store
Screenshots
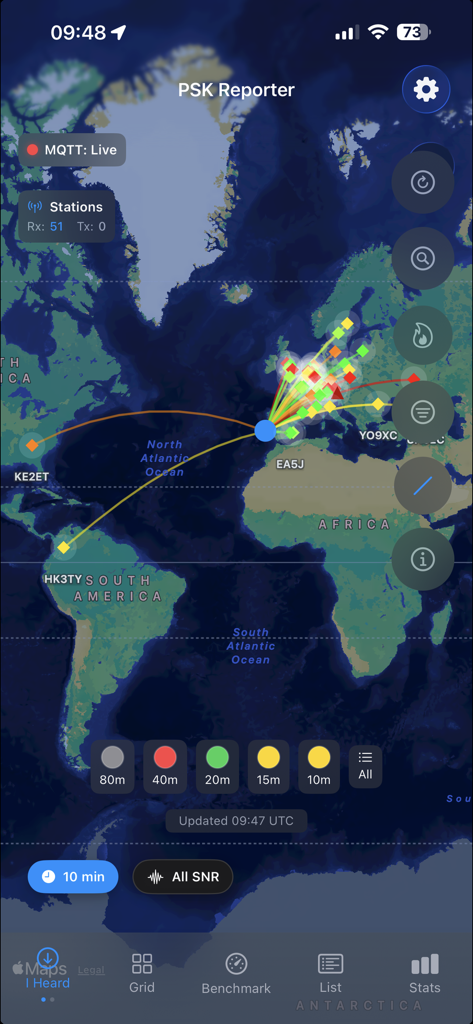
PSKReporter Client app interface showing signal propagation paths and band activity on a world map
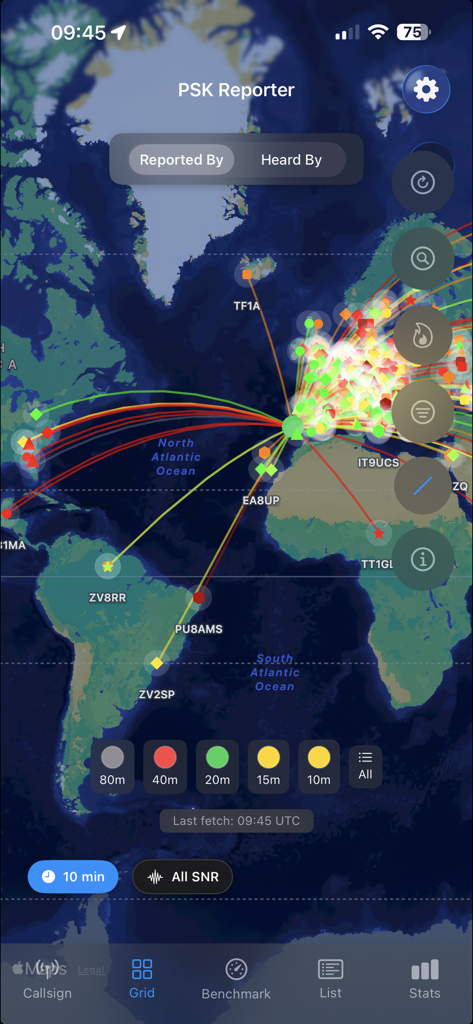
PSKReporter Client app map showing global amateur radio signal propagation paths and band activity
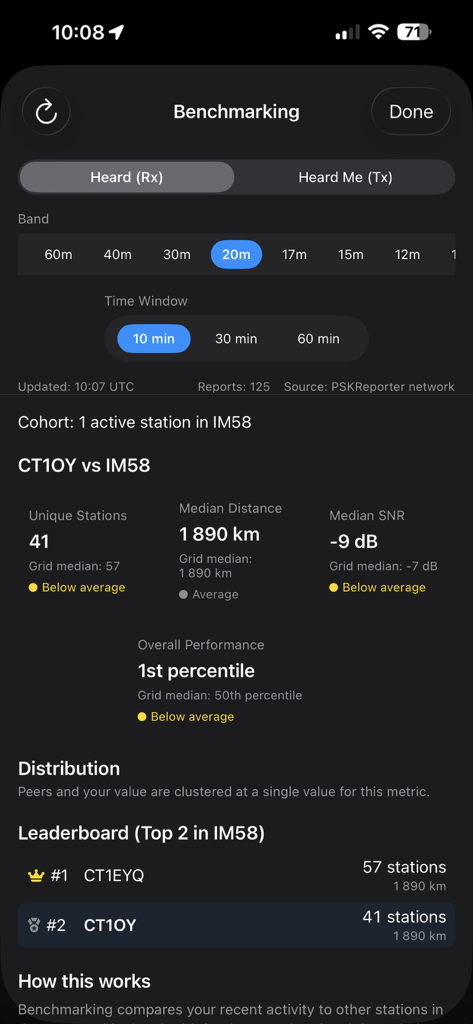
Ham radio station benchmarking dashboard showing performance metrics median distance and local leaderboard rankings
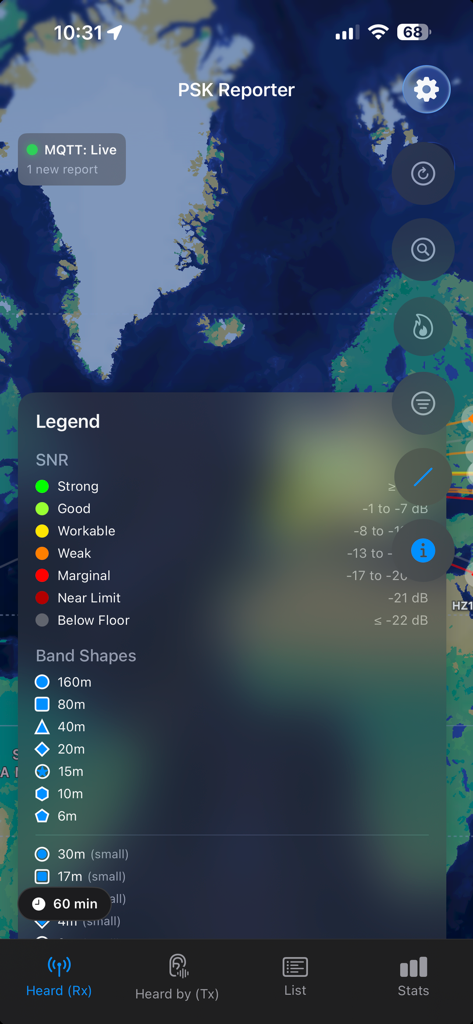
PSKReporter Client app legend showing signal to noise ratio and radio band shapes
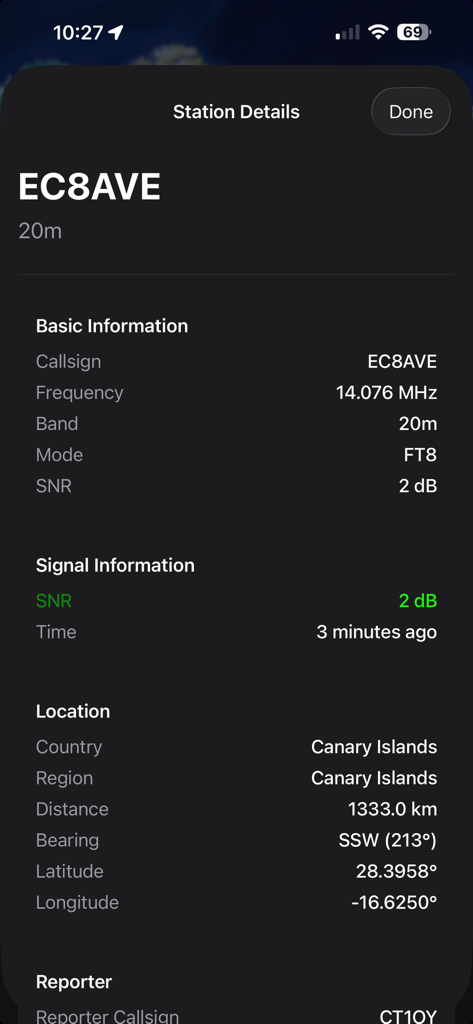
Mobile app screen showing amateur radio station details for callsign EC8AVE including signal strength frequency and location
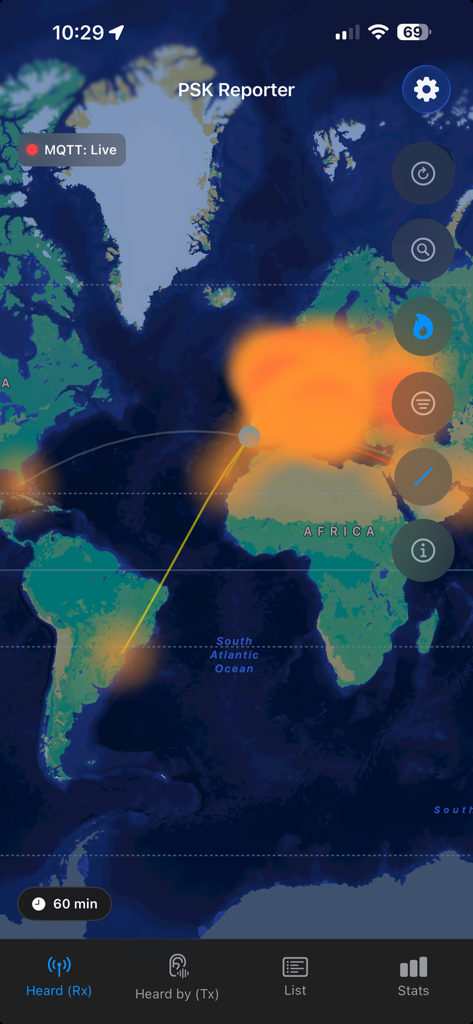
PSKReporter Client world map with signal propagation paths and density heatmap for digital radio modes
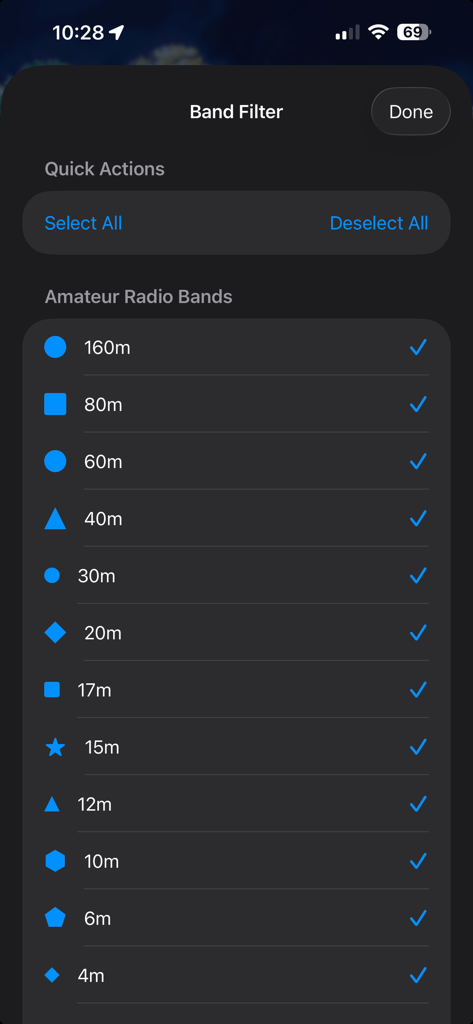
A settings screen in the PSKReporter Client app displaying a list of amateur radio bands with selection checkboxes for filtering propagation data.
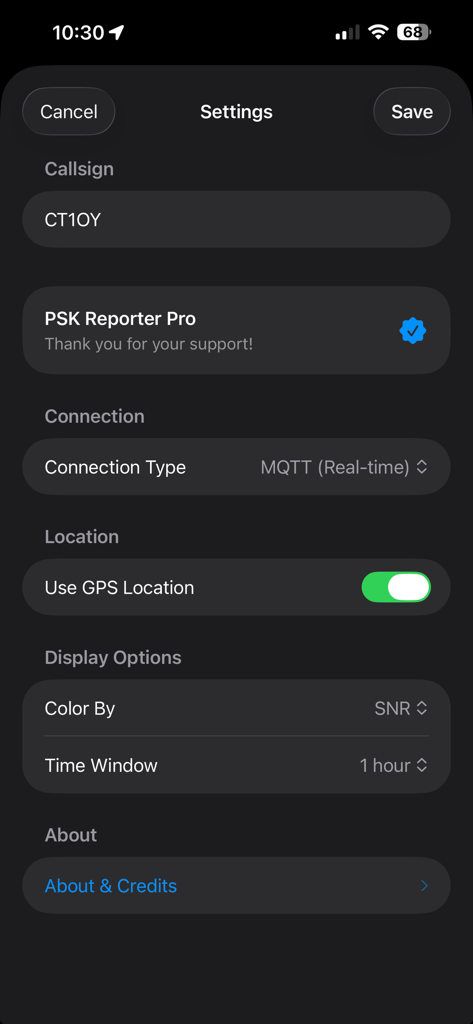
Settings menu of the PSKReporter Client app displaying callsign entry, MQTT connection type, and GPS location toggle.
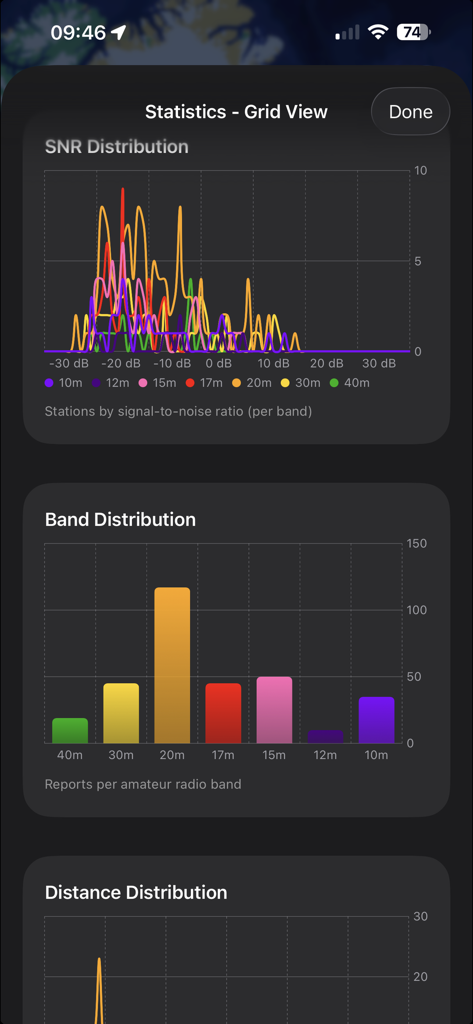
Amateur radio statistics view showing signal to noise ratio and band distribution graphs.
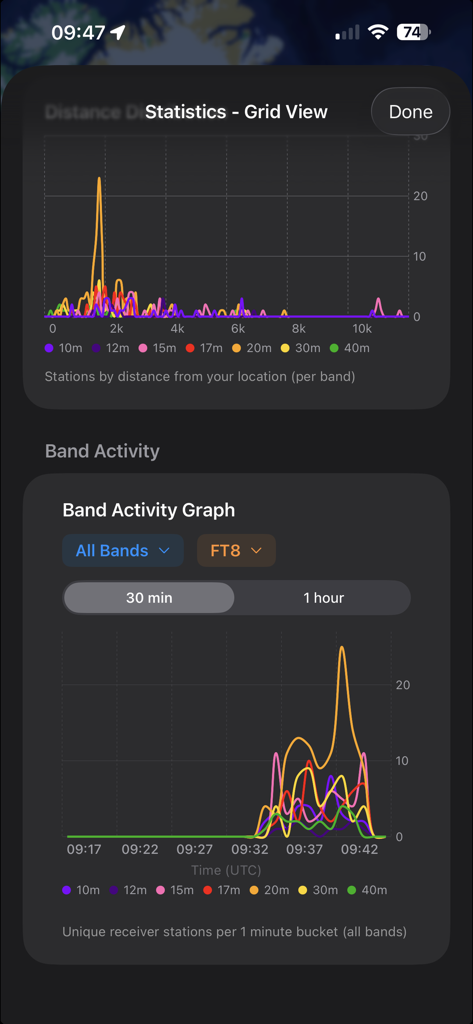
PSKReporter Client app interface displaying band activity graphs and distance statistics for ham radio digital modes.
Description
Download
More Like This
Top-ranked apps in the same category

Google LLC

Google Chrome
Google LLC

中国移动(手机营业厅)
China Mobile Online Services Co., Ltd.

Google Authenticator
Google LLC

Super VPN Fly 2026
YUNFAN TECHNOLOGY CO., LIMITED

gov.br
Servicos e Informacoes do Brasil

Cleanup: Phone Storage Cleaner
DEEP FLOW SOFTWARE SERVICES - FZCO

百度-AI智能搜索
Beijing Baidu Netcom Science & Technology Co.,Ltd

Microsoft Edge: AI Browser
Microsoft Corporation
This page is not an official page of the app or its developer, but an independent editorial publication created for informational and commentary purposes. Unless expressly stated otherwise, neither the app nor its developer is affiliated with, endorsed by, sponsored by, authorized by, or otherwise officially connected with MWM, Apple, Google Play, the app publisher, or the app's developer, and nothing on this page implies that the app was developed using MWM's services. Any trademarks, logos, screenshots, and other content remain the property of their respective owners.